Cities / Healthy Cities
Urban thermal comfort: a driver for wellbeing in the city
By Rafael Alonso Candau, Florencia Collo and Olivier Dambron | 09 Feb 2021 | 0
This paper presents a methodology to track people’s experience of thermal comfort in urban spaces, spotting existing areas of thermal stress that affect use and enjoyment of outdoor spaces.
Authors of scientific paper:
Abstract
Resilient cities have already been on the agenda for years, following UN’s Sustainable Development Goals 3 (Good health and wellbeing) and 11 (Sustainable cities and communities). Only in the recent context of a pandemic have cities accelerated their transformation: pedestrianising roads, widening pavements, and reducing cars’ dominance. Some of these interventions are succeeding more than others; if we are to rapidly humanise our cities, we better get it right.
This paper presents a methodology to track people’s experience of thermal comfort in urban spaces, spotting existing areas of comfort and discomfort that affect use and enjoyment of outdoor spaces. Furthermore, the physiological experience of thermal comfort is linked to health, wellbeing, creates a sense of belonging, and stimulates local economies by increasing frequentation. Recent technology has enabled the mapping of microclimates and, as a result, city planners are able to assess the impact of their fabric over space and time.
Cities, home to 55 per cent of the global population, succeed by concentrating talent, investment and economic activity. Yet denser urban areas increasingly modify their local climate: buildings directly amplify or mitigate the influence of the sun, winds and temperatures on people around them.
Humans, if provided choice, occupy the areas where they feel most comfortable – a sunny square during a crisp morning or a shaded terrace during a warm afternoon. Driven by adaptive behaviour and the diversity in urban spaces, people tend to concentrate in those areas better suited to each season.
The evidence of microclimates’ impact on urban dwellers is increasing: Gehl linked climate at a citizen’s spot to his wellbeing and the occurrence of social activities; NYTimes reports on shade as an equity issue in Los Angeles; New York qualified heat as a threat to its liveability; the Lancet links buildings and urban climate to chronic disease; Public Health England relates interventions that support health to increased local economies, footfall, and time spend on high streets; and Reinhard found that thermal comfort duplicates both people having lunch outdoors and its duration.
The methodology builds on the creation of microclimatic maps at human resolution – sun, wind and surface temperatures – and the combined effect these variables have on people’s comfort (defined by the Universal Thermal Climate Index). Urban geometry and physical properties are reconstituted in a computer model, which is simulated for each hour of the year according to hourly weather data.
This paper presents results of two case studies in Paris and Venice, and other observational evidence on the correlation between urban microclimates, thermal comfort and city dwellers. Preliminary insights about economic impact and increase of urban space use will also be discussed.
Keywords
Although the Sustainable Development Goals have been on urban agendas for years, the transformation of cities and the humanisation of their urban spaces has only accelerated recently: councils are now pedestrianising streets, local governments are reconquering roads, and businesses are expanding their offers outdoors. Leading cities have recently launched local policies to promote and guide these transformations:
- London introduced the Streetspace programme1 to encourage local boroughs to reallocate road space and provide safe and appealing areas to walk and cycle. Interventions are focused on improving the health and wellbeing of citizens and boost economic regeneration.
- Barcelona announced its Superblocks plan2 in the neighbourhood of l’Eixample, which aims to convert one in three streets into green pedestrian corridors and their intersections into urban squares. In total, a network of 21 corridors and 21 urban squares (2000m2) will be introduced progressively.
- Paris announced a series of traffic measures:3 30 streets were reserved to pedestrians to avoid overcrowding sidewalks, and 50km of lanes were designated bike-only, including the well-known Rue Rivoli.
- New York introduced the Open Streets programme4 and reserved up to 160km of roads to pedestrians to ease pressure on existing urban spaces. The city also launched Open storefronts and Open restaurant initiatives in 70 streets, to boost local economies by incentivising businesses to expand onto sidewalks and streets.5,6
Beyond these examples, and at the time of writing, a growing number of interventions are flourishing at an unprecedented rate in urban areas worldwide (see Figure 1).3,7
Urban climate 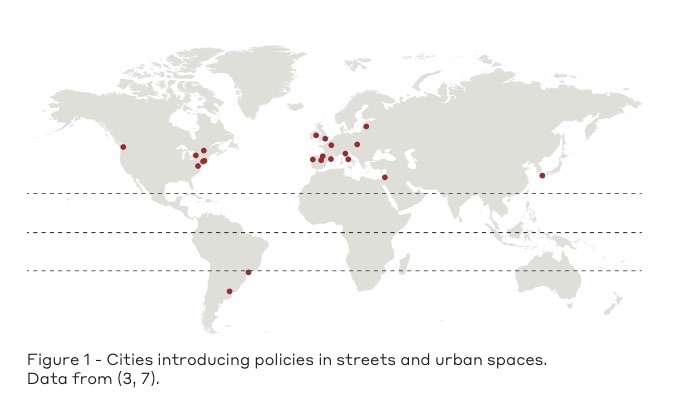
Urban climates affect the liveability of cities and while some urban areas function, others generate conditions unsuited for human activities. Although the world is only facing the early days of climate change, the resilience of certain areas is already eroded:
- The Mayor of Los Angeles highlighted urban shade as a privilege and raised it to an equity issue. The New York Times reports8 on city officials rushing to deploy cover trees, shade sails and umbrellas, and to plant 90,000 trees to ease the heat stress and “draw people back to the public realm”. Christopher Hawthorne, LA’s chief design officer, said: “If we can’t turn off the sunshine, at least we can find respite and refuge, and a sense that the city increasingly is designed for all of us.”
- Bloomberg Green identified9 some areas of Sydney as “too hot for people to live in”. They tie in appropriate urban and housing design to the difference between life and death on the hottest days, as researchers showed a temperature difference of 8oC between neighbouring suburbs.
- New York City introduced the Cool streets programme10 to keep its population cool and offer relief from urban heat during summer. Its aim was to ensure that every New Yorker living in a heat-burdened community remains within a quarter mile of an outdoor cooling element. It involved 14 streets being blocked from traffic, and dense tree canopies and water features included.
As data becomes available and climate change progresses, the reality of urban outdoor spaces is now legible: one can often notice spaces that do not offer the appropriate conditions to be used during large portions of the year (see Figure 2).

On a broader scale, the world population in urban areas is expected to increase by another 2.3 million inhabitants by 2050 – a 50-per-cent increase to current numbers.11 In this unprecedented explosion of urban growth, human settlements are increasingly responsible for our relation to climate: cities not only produce 70 per cent of global CO2 emissions but also modify climate within their own perimeter. Scientists have labelled this effect the urban heat island, describing how metropolitan areas are warmer than rural areas around them.12
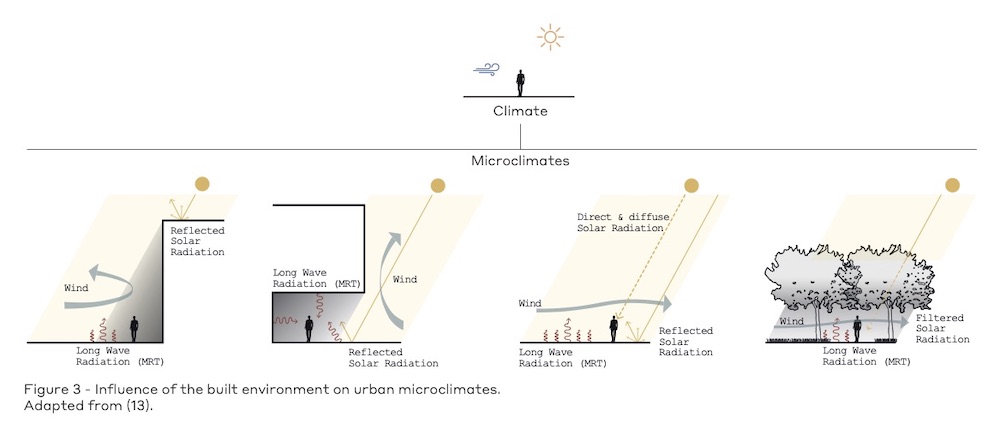
On a smaller scale, buildings around us influence the local weather by defining its access to the sun, wind and localised heat exchanges. The same climate might result in a wide range of microclimates, which vary across space and time (see Figure 3).13 Buildings around us, or perhaps their absence, regulate how the sun reaches the public space, and when; how the wind flows through the city, if it does; and how heat radiates between surfaces and people, or back to the sky. Considering climatic conditions above any city, different spots on the ground will present very distinct conditions depending on the immediate environment around them.
Increasing evidence shows the impact of these microclimates on human life: the Lancet links urban climate and buildings to chronic disease;14 New York qualified heat as a threat to its liveability;15 researchers linked microclimate to the frequency and duration of lunch outdoors;16 and Jan Gehl linked local climate to citizens’ wellbeing and the frequency of social activities.17
Human comfort
Unlike indoor spaces, people use outdoor spaces at their free will – successful areas act as a magnet to draw people out, for socialising, exercising or resting. Nowadays, Covid-19 has subjected cities to a stress test and it has become essential to allow people to socialise and exercise safely; people depend more than ever before on external comfort conditions. 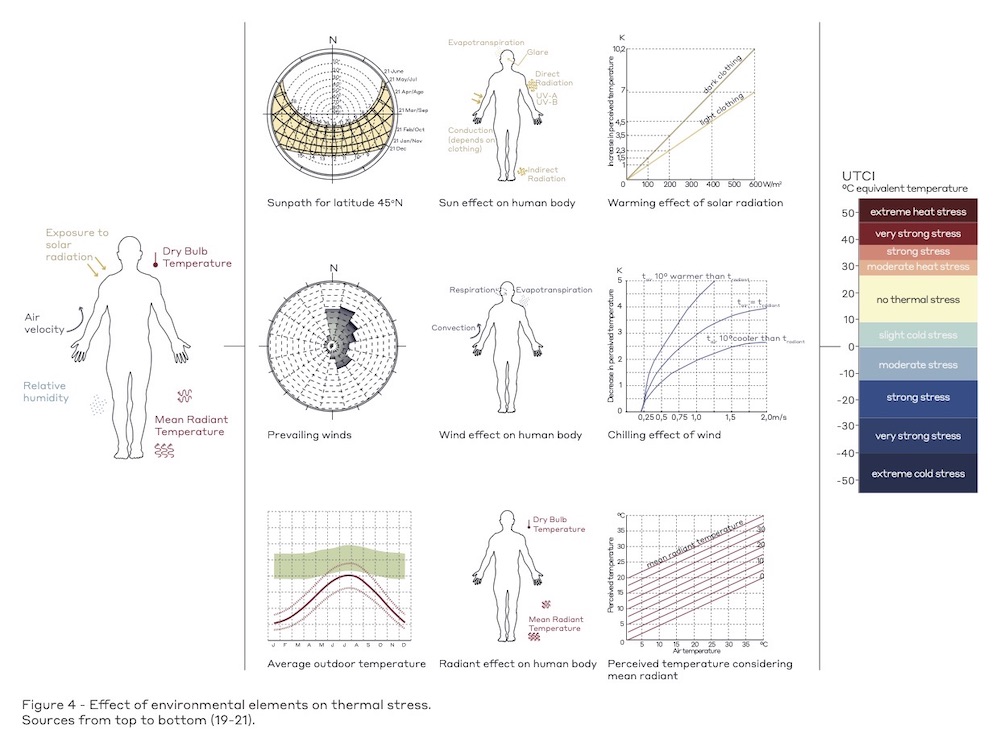
Even if we rarely pay attention to it, humans often sit at the sunny table in a cafe or rush for the shaded bench during a heatwave. On any spring day, access to the sun may be the variable that makes one comfortable in temperate climates like London or Paris, while strong winds easily keep people away. At warmer latitudes, prolonged exposure to the sun can induce heat stress even during mild days, while a cool summer breeze can be a delight.
Human comfort in urban environments is affected by many parameters and is best calculated using the Universal Thermal Climate Index (UTCI).18 The UTCI can be defined as the temperature it feels like. At microscale, the UTCI depends mostly on the intensity of the sun and the velocity of the wind to which we are exposed, and the temperature of the surfaces that surround us. These factors are combined in an equivalent temperature that correlates with the physiological processes the body goes through as it attempts to retain its thermal balance: from the sweat rate to shivering, to variations in body and skin temperature or dehydration (see Figure 4). Thermal comfort or thermal stress on public spaces are increasingly correlated with outcomes affecting health, urban life and the economy:
– Thorsson et al21 found that a 10-per-cent increase in mortality risk for older age groups was attributed to the combination of harmful weather and urban geometries. Including the effect of urban geometries and surface materials in predictive models increased their accuracy to foresee the mortality caused by heatwaves, as they describe better the weather conditions conducive to heat stress.
– Aljawabra and Nikolopoulou22 showed that air temperature and solar radiation influence the use of the outdoor spaces in hot arid climates and may determine the number of people in them. Adverse microclimate effects in Phoenix and Marrakech were suffered more by lower socioeconomical groups, as they could not afford to have air conditioning at home and had to cope with the urban heat.
– Thorsson, Lindqvist and Lindqvist23 found that the number of people increased with radiant temperature in a Swedish park. At a certain point, the number of users in the shade started to grow as they adapt to warmer conditions. The researchers concluded: “Creating a variety of microclimates, ie, sunny, shady, sheltered and exposed sub-spaces in outdoor public places, will increase both the physical and psychological adaptation. As a result, usage of outdoor spaces will be increased throughout the year.”
– Reinhart, Dhariwal and Gero16 showed that “preferred UTCI predictions are a strong predictor of both the amount of locals frequenting an outside space as well as their dwell time”. Results from thousands of UTCI assessments correlated with a double probability of regulars having lunch outside. Also, the median lunchtime duration increased by 50 per cent (from 8 to 12 minutes) for conditions under no or moderate heat stress.
– BNP Paribas, the real estate company, discusses the impact of microclimate on rent prices for the Champs-Élysées, the equivalent to the 5th Avenue in Paris, visited by 130 million people a year.24 They attribute increased rental prices (+85 per cent) to the increased footfall caused by the sun on one side (16-20,000€/m2) when compared to the opposing shaded side (9–10,000€/m2). 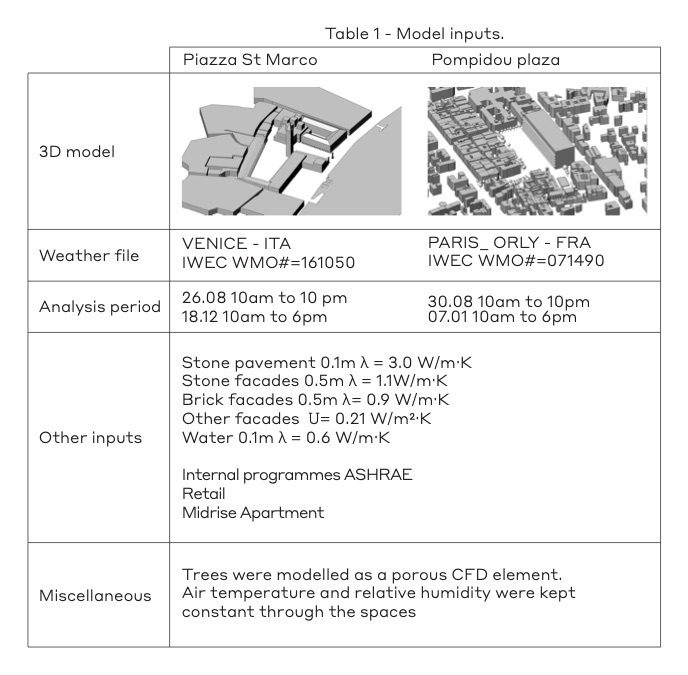
Nowadays, technology makes it possible to combine 3D modelling tools with statistical weather data and human biometeorological indices to calculate thermal stress, or its absence, at any point in an urban space. The following case studies illustrate how urban squares modify local microclimates, and how they affect thermal stress on their visitors.
Case studies:
Methodology:
The following case studies were produced using Ladybug tools,25 a 3D reconstitution of the surrounding environment and the inputs defined in Table 1.
Piazza St Marco, Venice
Piazza St Marco is an L-shaped square located in central Venice. The central area facing the main entrance of the cathedral extends along the east-west axis, while there is a secondary area next to the Grand canal (see Figure 5). The square is surrounded by arcades, which shelter pedestrians from the sun or rain. Climate in Venice varies from a minimum average temperature of 2.5oC in winter mornings (corresponding to slight cold stress) to a maximum average temperature of some 28oC in summer afternoons, which corresponds to moderate heat stress.
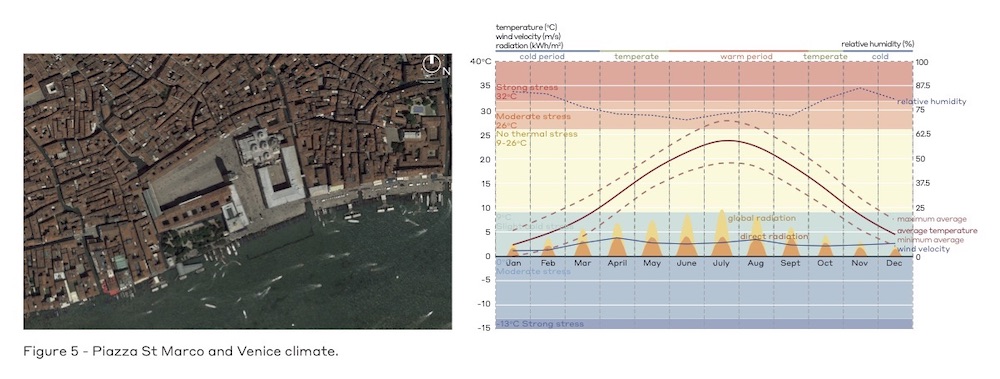
The square has no other urban features than its original morphology, which generates clear patterns of how the sun and wind reach certain areas, and how much the pavement absorbs the heat of the sun. The lack of urban elements in the square (ie, shades or trees) creates zones with strong variations in thermal conditions both during summer and winter.
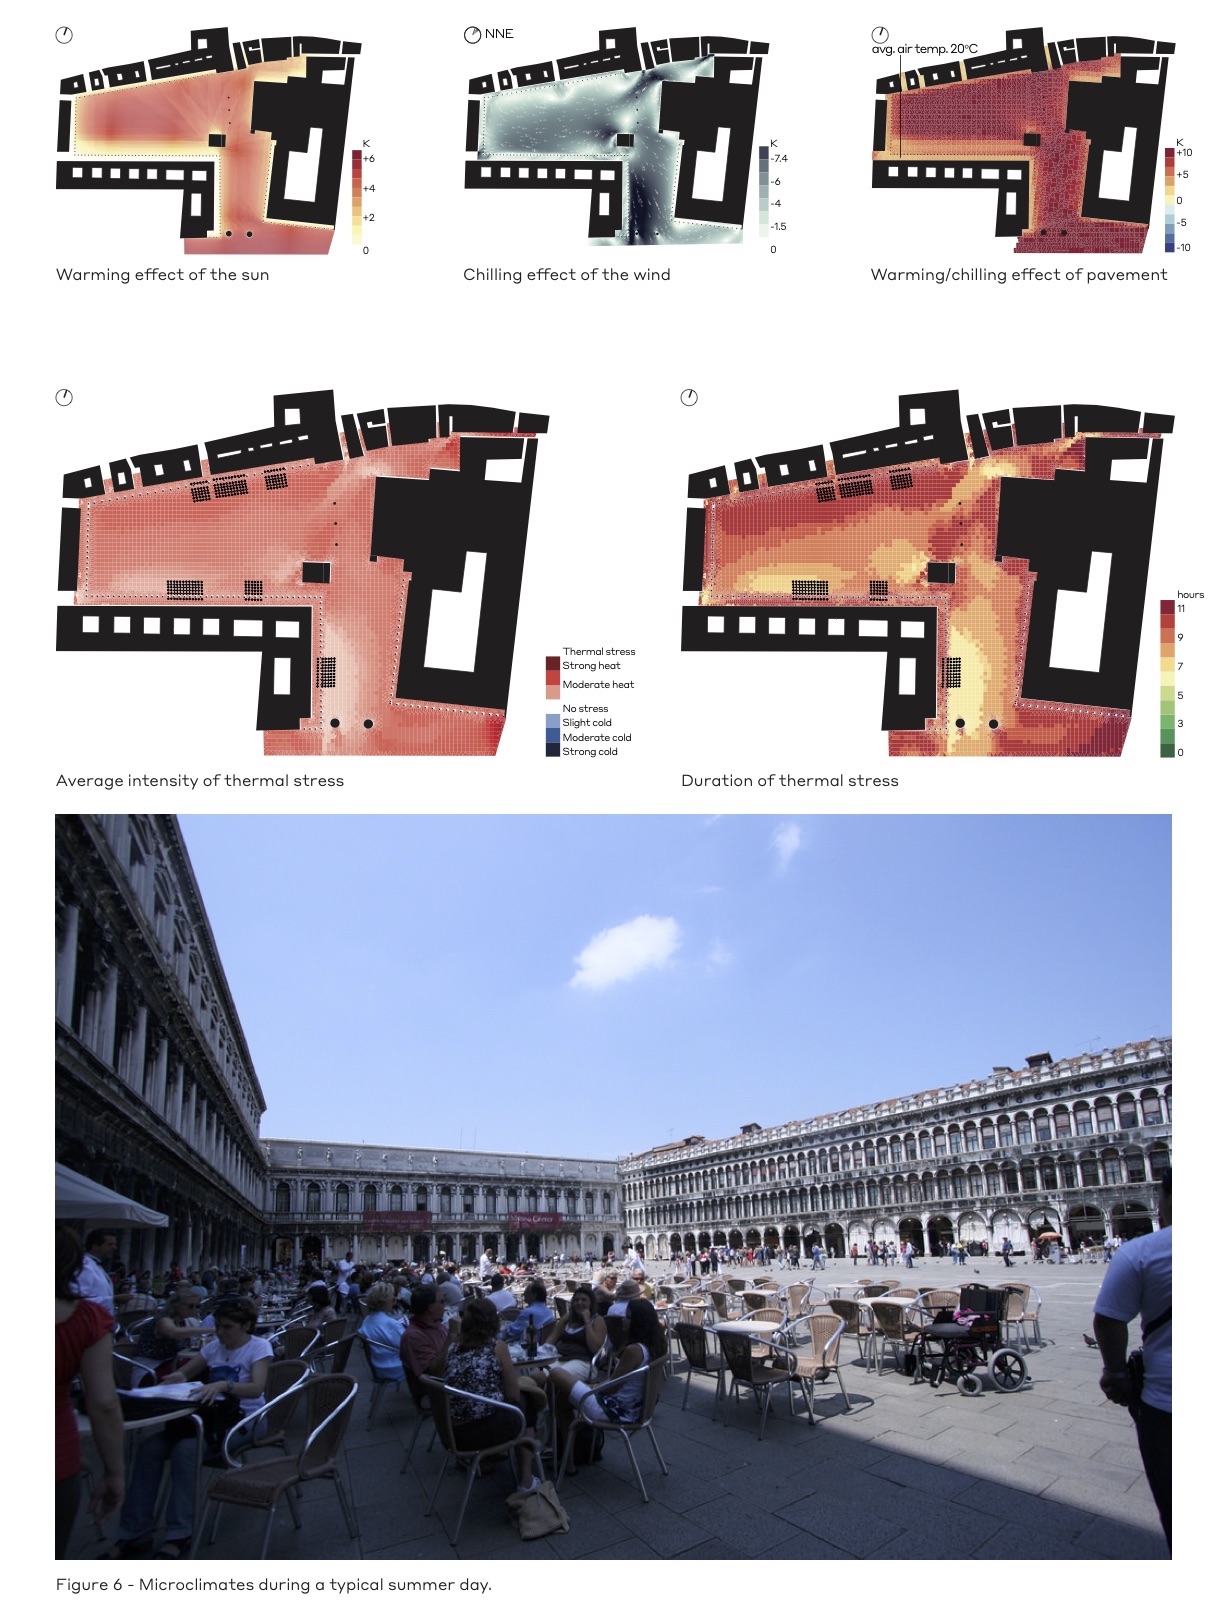
In summer, heat stress or comfort in the square is determined by shade and wind flow patterns and the areas where they overlap (see Figure 6). The north area of the square induces permanent heat stress during a typical summer day, where thermal stress averages at moderate stress. The central area of the square receives wind breeze from the northeast, which reduces the duration of heat stress by three to four hours. On the south side, the overlapping effect of the wind, shade and cooler pavement halve the time under stress and reduce its severity to almost no stress. It can be observed that some cafes identified and took advantage of these patterns over time, and how the shaded areas of their terraces are packed with people avoiding the unpleasant areas.
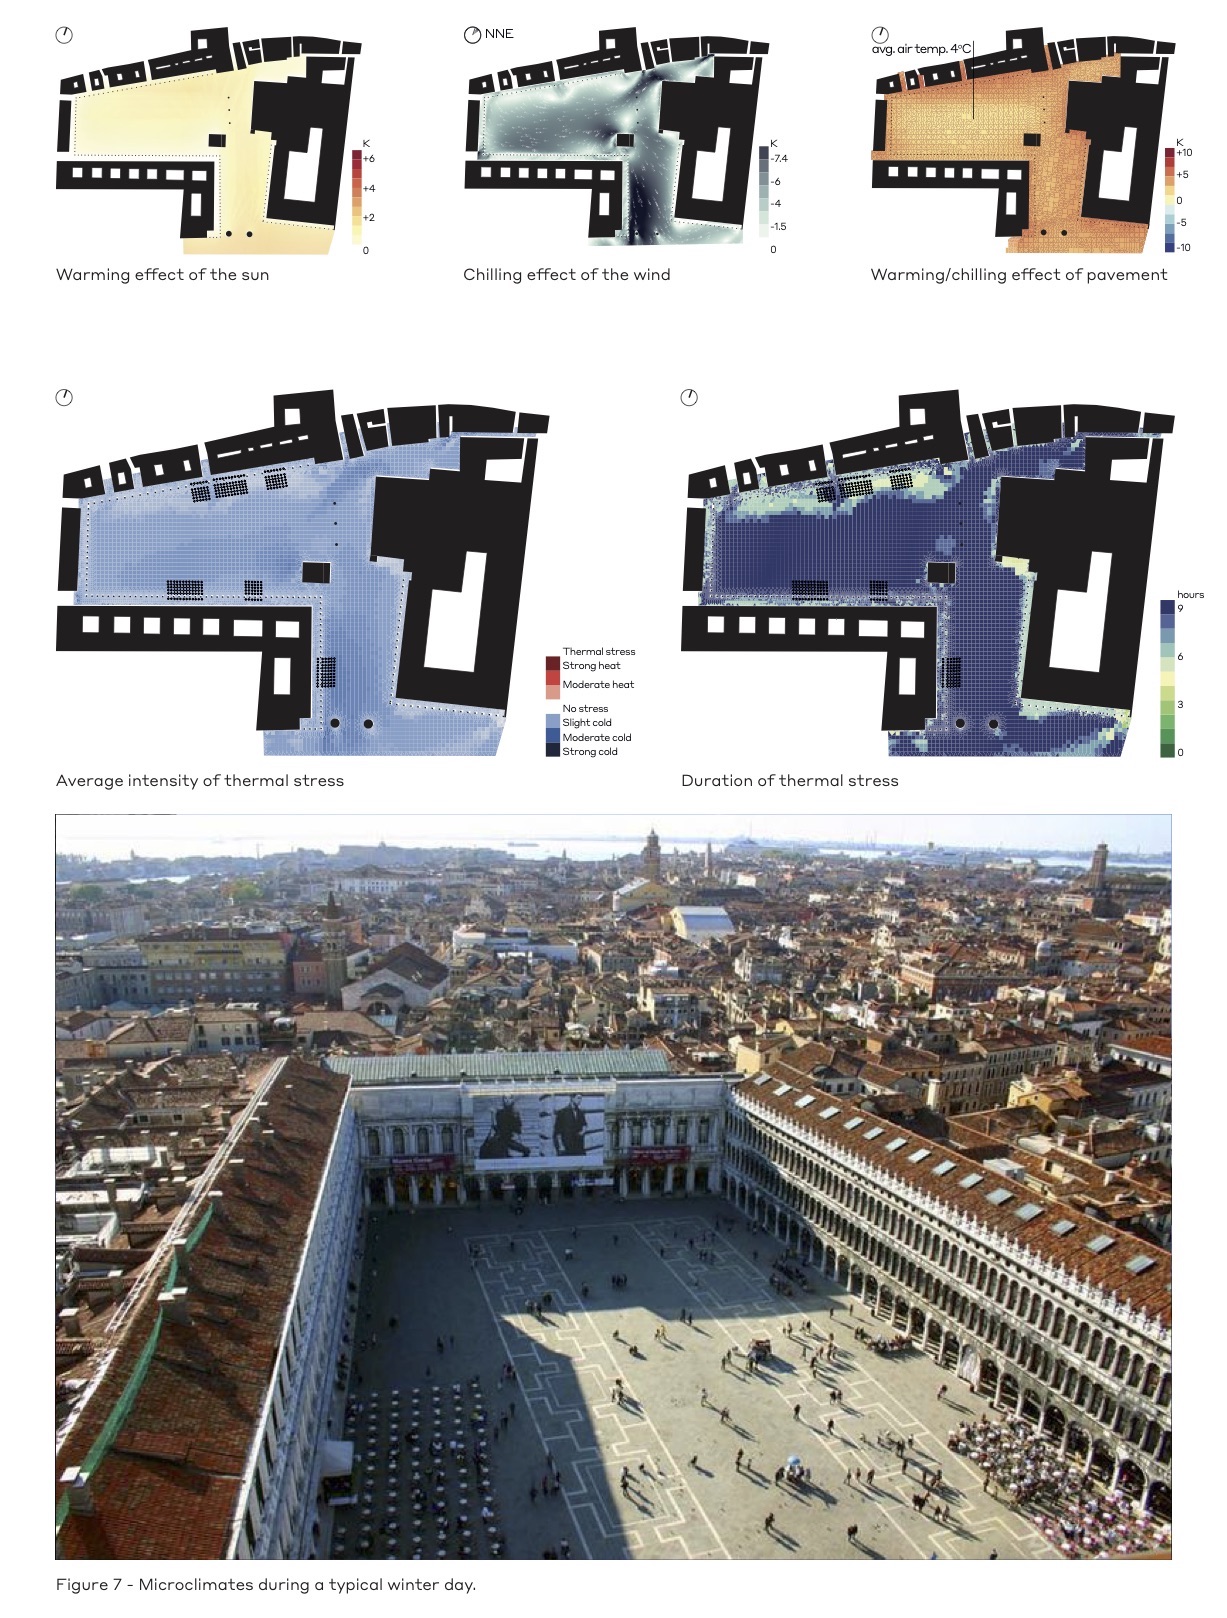
In winter, cold stress is induced in most of the square during the entire day, since the sun is not strong enough to mitigate colder temperatures (see Figure 7). Only the north area, sheltered from the wind and exposed to the sun, spares cold stress to the visitors between four and five hours during the day. Of the remaining areas, those by the canal suffer the strongest cold stress, which is accentuated by the overlapping effect of the wind, shade and cooler pavement, and these reach moderate stress. Conversely to summertime, terraces located on the north side are largely frequented, as pleasant conditions attract most visitors.
Pompidou plaza, Paris
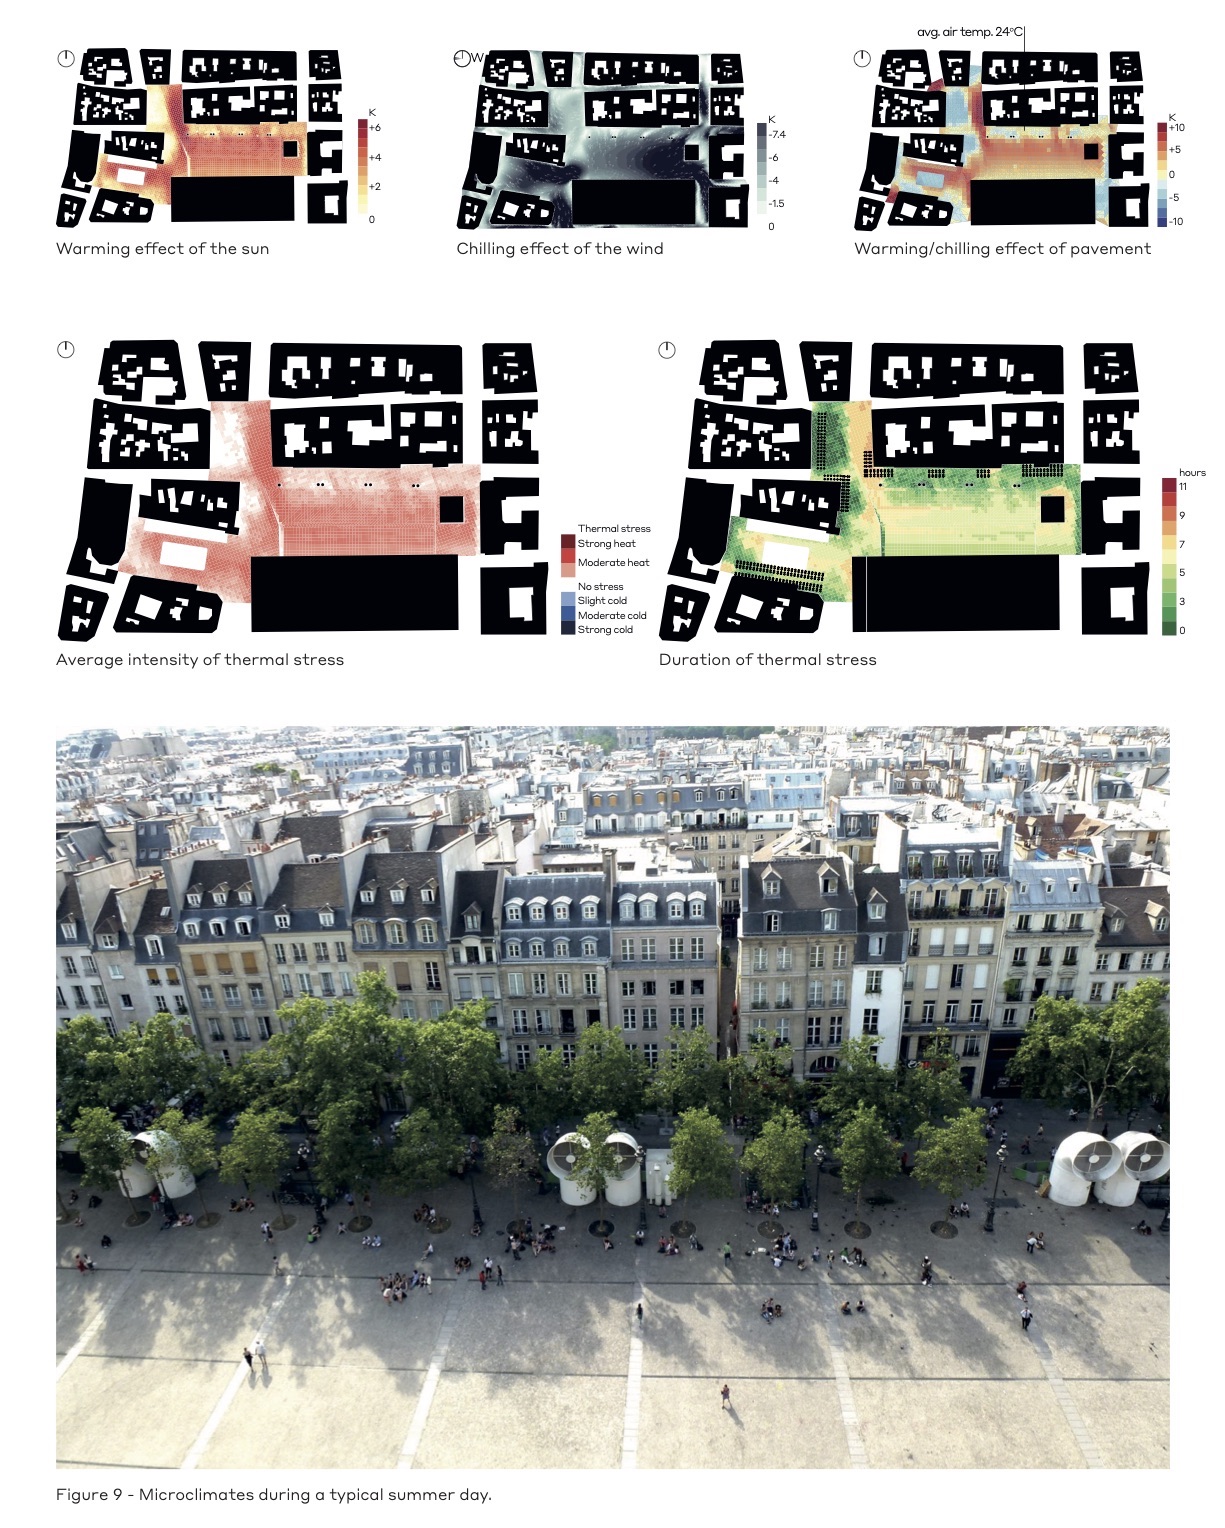
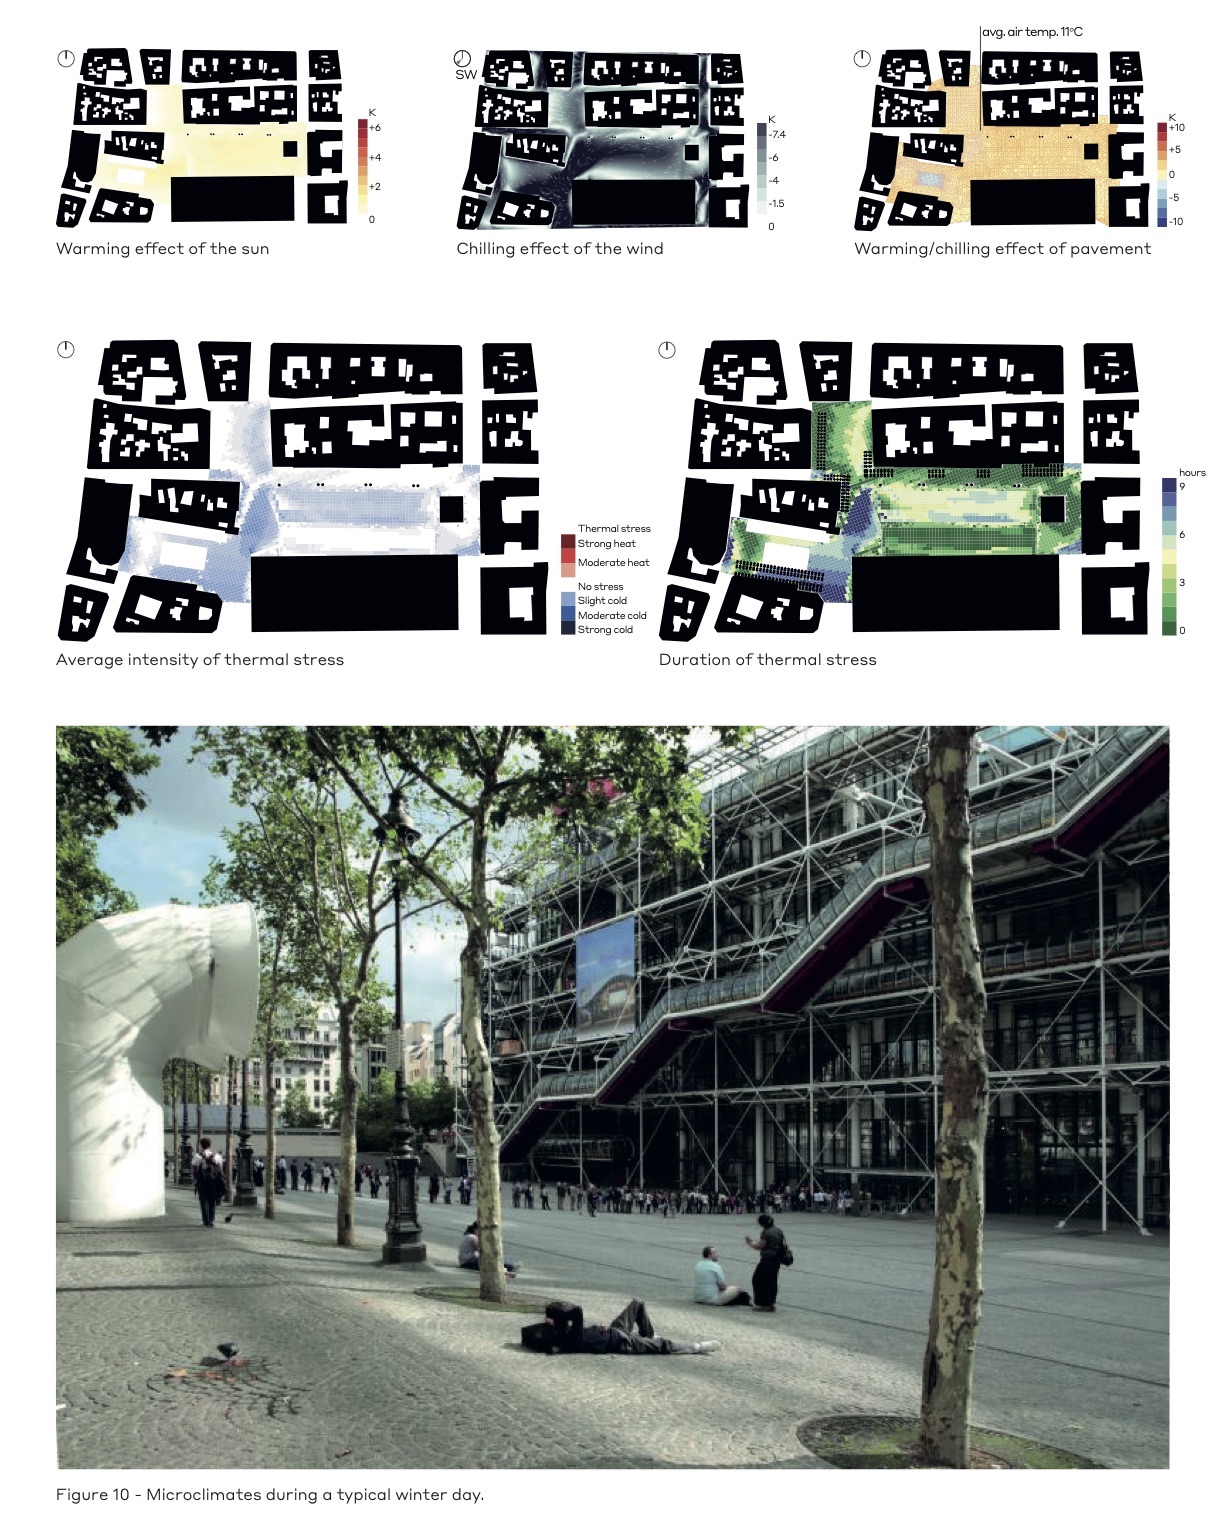
Pompidou plaza is in central Paris, where the renowned museum under the same name is located. Three squares converge in this area, generating irregular urban pockets of different sizes. Most of the perimeter buildings have similar heights, while the Centre Pompidou is notably higher. Paris’ climate is milder than Venice and ranges from a minimum average temperature of 5oC in winter mornings (corresponding to slight cold stress) to a maximum average temperature below 25oC in summer afternoons, outside any thermal stress (see Figure 8).
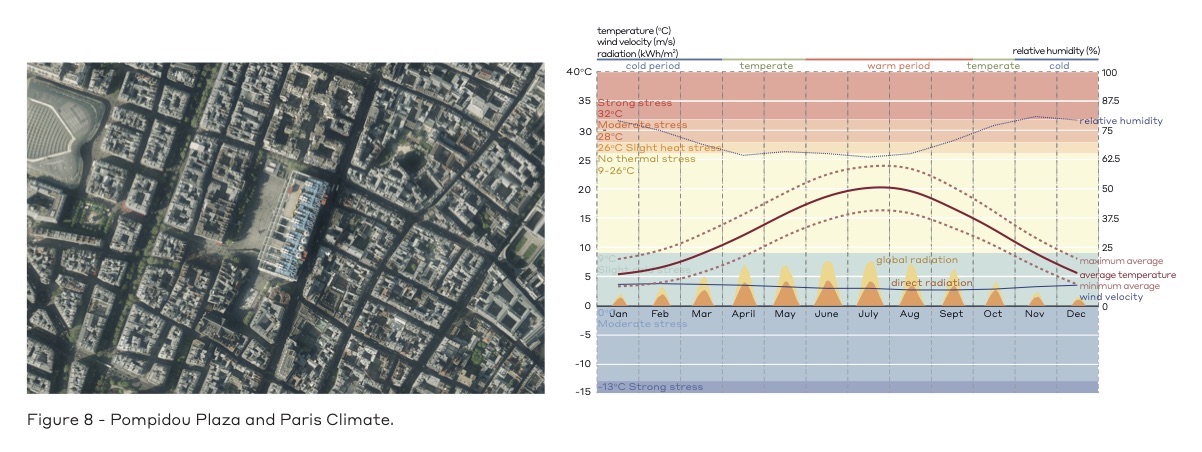
The urban squares are occupied by a multitude of urban features: enormous ventilation pipes, trees of varying sizes, and water features. While the urban morphology will shape some broader areas of thermal stress, these additional features play a role in mitigating unwanted effects.
In summer, the thermal sensation is dominated by the sun and three areas are defined according to the duration of heat stress: well-shaded areas on the edges show stress for less than three hours, central areas exposed to the sun and breeze show five hours, and those under the sun and sheltered from the wind show eight hours (see Figure 9). The severity of heat stress is divided similarly across the square, which peaks on the west area where it averages at moderate stress for the day. Urban shade generated by trees and pipes mitigates the impact of the sun on the central larger square, both in terms of the duration (three hours less) and severity of heat stress. It can be observed that people dwelling for longer periods in the square accumulate by those elements, which also seem to have attracted cafe terraces.
During winter, the key factor is wind shelter, as the Centre Pompidou funnels strong winds down into the ground realm and the sun is not intense (see Figure 10). Areas exposed to the wind show seven hours or more of cold stress, only reduced by two hours where they overlap with the sun. The zones of the central square located below the trees or by the museum receive additional protection from the wind and exposure to the sun, which minimise cold stress across the day to only one or two hours. It can be observed that these seem to be the areas where people stay around the square.
Discussion
Building geometries and urban design directly influence the duration and severity of thermal stress in the case studies: duration can vary up to nine hours, while average stress ranges from no stress to moderate within just a few metres apart. The specific relation of each spot to the surrounding environment and climatic factors defines the time and intensity of thermal stress induced to citizens of both locations.
Smaller design features located in Pompidou plaza break large patterns in thermal conditions, which are generated by the buildings around it. Variations in time under stress and its intensity across the French plaza are less drastic than across St Marco, a widely open square. Elements functioning as wind barriers or solar shading would reduce the intensity and duration of thermal stress around them, during winter and summer respectively.
Only the French plaza achieves overlapping areas under no stress both during summer and winter. Areas with trees block the high summer sun while allowing the lower winter sun below the branches, and some urban pockets shelter pedestrians from the summer sun and winter winds. Comfortable areas in St Marco move across the square during the year, and no spot is free of thermal stress during some season.
Conclusions
Technology now allows the ability to quantify environmental variables and predict thermal conditions in urban spaces at greater resolutions, both over time and space. Computational simulations have proven to relate to how people use the studied spaces, whereas availability of future climate data sets following the Intergovernmental Panel on Climate Change (IPCC) allows for the prediction of conditions for the years to come.
Thermal comfort predictions can be used to identify and design out factors inducing thermal stress while making decisions on urban spaces: zoning or designing interventions on squares, shaping new areas, or diagnosing which part of the urban fabric to focus on. While availability of public space may not always be the bottleneck, its utility always needs to be guaranteed. As discussed in the body of this paper, microclimates play a key role on the quality of urban spaces.
Ensuring the liveability of the public realm begins by looking closely at the human scale, as large variations in thermal stress can occur a few metres apart within urban spaces. The increasing evidence that health, urban life, and local economies are linked to microclimates suggests that adding a bottom-up approach to top-down interventions can improve the overall performance of urban areas.
Cities are now laying down their blueprints for the years to come, and planning urban interventions at a scale unseen since the invention of the car. At such a crucial moment, insights and evidence supporting life in cities should be implemented to ensure a successful transition.
About the authors
Rafael Alonso Candau MArch, RIBA, Florencia Collo Arch, MSc, PLEA associate (Passive Low Energy Architecture: international conference) and Olivier Dambron Eng MSc, GCIBSE are three co-founders of Atmos Lab – environmental design consultancy. Their work focuses on resolving environmental issues by design and their approach is evidence-based, climate-specific and occupant-centred.
References
- London Streetspace Plan – Interim Guidance to Boroughs. Mayor of London, Transport for London; 2020.
- Ajuntament de Barcelona. Convertimos Barcelona en una gran supermanzana. Available from: https://ajuntament.barcelona.cat/superilles/es/noticia/convertimos-barcelona-en-una-gran-supermanzana [Accessed 29 November 2020].
- Akhmouch, A, and Taylor, A. Cities Policy Responses. OECD, 2020.
- New York City. Open streets. Available from: https://www1.nyc.gov/html/dot/html/pedestrians/openstreets.shtml [Accessed 20 November 2020].
- New York City. Open storefronts. Available from: https://www1.nyc.gov/html/dot/html/pedestrians/openstorefronts.shtml [Accessed 20 November 2020].
- New York City. Open restaurants. Available from: https://www1.nyc.gov/html/dot/html/pedestrians/openrestaurants.shtml [Accessed 20 November 2020].
- International Monetary Fund. Policy responses to Covid-19. Policy tracker. Available from: https://www.imf.org/en/Topics/imf-and-covid19/Policy-Responses-to-COVID-19 [Accessed 22 November 2020].
- New York Times. Turn off the sunshine: Why shade is a mark of privilege in Los Angeles. Available from: https://www.nytimes.com/2019/12/01/us/los-angeles-shade-climate-change.html [Accessed 10 November 2020].
- Bloomberg Green. Sydney’s new suburbs are too hot for people to live in. Available from: https://www.bloomberg.com/news/features/2020-09-15/sydney-s-new-suburbs-get-so-hot-that-people-could-die-there [Accessed 14 November 2020].
- New York City. As summer enters full swing, New York City builds “cool streets” onto nation-leading open streets program. Available from: https://www1.nyc.gov/office-of-the-mayor/news/500-20/as-summer-enters-full-swing-new-york-city-builds-cool-streets-nation-leading-open-streets [Accessed 21 November 2020].
- World Urbanization Prospects: The 2018 Revision. United Nations, Department of Economic and Social Affairs, Population Division; 2018.
- National Geographic Resource Library. Urban heat island. Available from: https://www.nationalgeographic.org/encyclopedia/urban-heat-island/ [Accessed 28 November 2020].
- Al Sabbagh, Nihal. Walkability in Dubai: Improving thermal comfort. PhD thesis, The Open University; 2019.
- Rydin, Y, Bleahu, A, Davies, M, Dávila, JD, Friel, S, De Grandis, G, Groce, N, et al. Shaping cities for health: Complexity and the planning of urban environments in the 21st century. The Lancet. Vol. 379, No. 9831, p2079-2108; 2012.
- OneNYC 2050 Building strong and fair city. A liveable climate, Volume 7 of 9. New York City; 2019.
- Reinhart, C, Dhariwala, J, and Gerob, K. Biometeorological indices explain outside dwelling patterns based on Wi-Fi data in support of sustainable urban planning. Building and Environment. 126: 422-430; 2017.
- Gehl, J. Cities for people. London: Island Press; 2010.
- UTCI Universal Thermal Climate Index. Available from: http://www.utci.org/index.php. [Accessed 4 November 2020].
- Chartered Institution of Building Services Engineers. CIBSE Guide A: Environmental Design. London: CIBSE; 2017.
- International Organization for Standardization. ISO 7730:2005. Ergonomics of the thermal environment – Analytical determination and interpretation of thermal comfort using calculation of the PMV and PPD indices and local thermal comfort criteria. Geneva: ISO; 2005.
- Thorsson, S, Rocklöv, J, Konarska, J, Lindberg, F, Holmer, B, Dousset, B, and Rayner, D. Mean radiant temperature – a predictor of heat-related mortality. Urban Climate. 10: 332-345; 2014.
- Aljawabra, F, and Nikolopoulou, M. Thermal comfort in urban spaces: A cross-cultural study in the hot arid climate. International Journal of Biometeorology. 62, 1901-1909; 2018.
- Thorsson, S, Lindqvist, M, and Lindqvist, S. Thermal bioclimatic conditions and patterns of behaviour in an urban park in Goteborg, Sweden. International Journal of Biometeorology. 48(3): 149-156; 2004.
- BNP Paribas Real Estate. Champs-Élysées: Géant immobilier hors norme. Available from: https://www.limmobilierdunmondequichange.fr/champs-elysees-geant-immobilier-norme/ [Accessed 2 February 2020].
- Ladybug Tools. Making environmental design knowledge and tools freely accessible to every person, project and design process. Available from: www.ladybug.tools [Accessed 1 January 2020].
Organisations involved
