Cities / Active travel
Older pedestrians’ physiological reactions are indicative of stressful and non-stressful urban built environment conditions
By Dr Alex Torku, Dr Albert P. C. Chan, Dr Esther H. K. Yung and Dr JoonOh Seo | 09 Jan 2023 | 0
This study examines whether older pedestrians’ physiological reactions, measured using wearable sensors, are indicative of urban built environment stressors.
Authors of scientific paper:
Abstract
This research examines whether the physiological responses, measured using wearable sensors, among older adults vary by stress and non-stress environmental conditions. The physiological responses – specifically, heart rate variability and electrodermal activity – and perceived stress among ten older adults were measured while walking along an urban path. The path condition was assessed by two trained observers.
The differences in participants’ physiological responses (individual and collective) and individual differences (including body mass index and gender) under perceived stressful and non-stressful path conditions were tested using Wilcoxon signed-rank. A test for clustering of physiological responses was conducted among all participants and associated perceived stress and non-stress path conditions. In addition, a spatio-temporal analysis was conducted to detect variation in physiological responses within the stress and non-stress path conditions.
Results indicated that, on average, participants experienced a statistically significant higher physiological response to environmental conditions perceived as non-stress than environmental conditions perceived as stress. Women experienced a significantly higher physiological response to non-stress environmental conditions than men. Stressful environmental conditions pose a high demand to older adults with a body mass index above 24.9. Personal factors and time-dependent environmental factors influence the effectiveness of wearable physiological sensing; nevertheless, such sensing can complement existing built environment assessment approaches to improve active ageing and age-friendly city and community design.
Keywords
Introduction
Globally, one in six people is expected to be of age 65 years or older by 20501. With the changing age structure of the projected population, many cities and communities are now committed to promoting active ageing. The World Health Organization (WHO) propounded the active ageing concept to stimulate cities and communities to create an enabling environment for older adults to continue participating in social, economic, civic engagement and physical activity, in order to enhance their quality of life as they age2,3. However, attaining this active ageing potential requires older adults to achieve successful mobility to gain access to their desired places (physical environment) and people (social environment). Despite the fundamental importance of mobility to active ageing, studies have reported a decline in the older adults’ mobility indices, such as time spent outdoors, trip frequency, and trip distance4,5. To promote mobility, it’s not enough to target only the individual (e.g. physical activity counselling and educational interventions to increase older adults’ physical activity) because environmental barriers also limit mobility among older adults6.
An environmental barrier is a relative concept; dependent on the interaction between an individual’s capability and environmental demand. When environmental demand meets a person’s capability, the person can achieve successful mobility. On the other hand, the person experiences stress and/or their mobility is limited when the environmental demand exceeds their capability7-9. Stress is a type of relationship between a person and the environment that occurs when demands tax or exceed the person’s capability10. As functional capacity declines with ageing, it’s more likely for older adults to experience stress – potentially leading to mobility limitation – in the built environment than the average person. Older adults’ interaction with excessive environmental demands can even be overwhelming in cities and communities with built environment infrastructure approaching design life.
Recent advancements in sensing technologies offer a great opportunity to continuously monitor and provide a more human-centred assessment of the built environment11,12. Human-centric sensing is a new generation of interdisciplinary research that measures human users’ direct reactions to their interactions with different built environments13. Older adults usually achieve mobility in outdoor neighbourhood environments either by walking on foot or by using mobility aids, the most common of which are a walking stick, walking frame or wheelchair. Most existing studies that use wearable sensing technologies focus only on humans or the interaction between humans. A few of these studies that focus on human-environment interaction often attach sensors to the mobility aid to assess the environmental condition14,15. An example is a recent study that attached inertial sensors to the users’ wheelchairs to detect urban features, such as kerb ramps, steps or other obstacles, along a path14. Although these studies prove the feasibility of using sensor data collected during human movement to assess an environmental condition, they might not be a good representation of human-environment interaction. Human responses to environmental conditions are more complicated than mobility aid usage. As a result, sensors attached to older adults are inherently subject to greater variability than sensors attached to mobility aids, which could affect assessment of the built environment. Therefore, it’s essential to understand the variability in older adults’ responses to different environmental conditions before adopting human-centric sensing.
Research aim
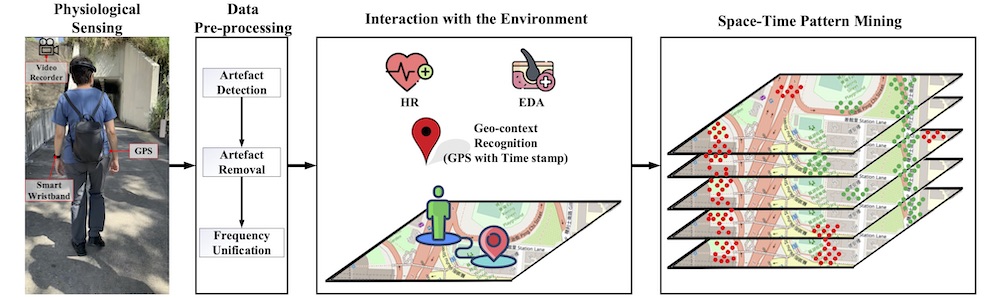
This study examines whether older pedestrians’ physiological reactions, collected from wearable sensors, are indicative of urban built environment stressors. The physiological signals are involuntary actions or responses that are almost impossible to notice by external observation because they relate to how a living organism or bodily part functions16. When the body is stressed, the autonomic nervous system provokes human responses, which are reflected in their physiological signals16,17. This research examines whether the physiological responses that older adults naturally and unconsciously portray while interacting with different environmental conditions may offer vital information about the environment’s condition. The results from this study will be useful for urban planners and future researchers who want to adopt human-centric sensing to achieve a more efficient and timely assessment of older adults-environment interactions to inform urban planning and design. Figure 1 is an overview of the study.
Experiment design and methods
Experiment design
A 570m walking path was predetermined in the neighbourhood of Hung Hom, Hong Kong, as shown in figure 2. The path consists of spacious and narrow streets; green and high-density building areas; playgrounds, a gas station; a car wash; a car fitting shop; crosswalks (with and without traffic or pedestrian signals); sidewalks with even and uneven slopes; and different street materials, among other features. Ten older adults (seven women and three men; age range = 65-75; average age = 68; body mass index above 24.9 = 6; body mass index below 24.9 = 4) were recruited to participate in an environmental walk. Eligibility was assessed based on the participant’s ability to walk unassisted by another person for at least 15 minutes and to meet the recommended score for the Cantonese version of the Mini-Mental State Examination18,19. The environmental walk was carried out in November 2019 between 10am and 4pm. The environment temperature ranges from 24°C-29°C and the humidity ranges from 41 per cent to 55 per cent.
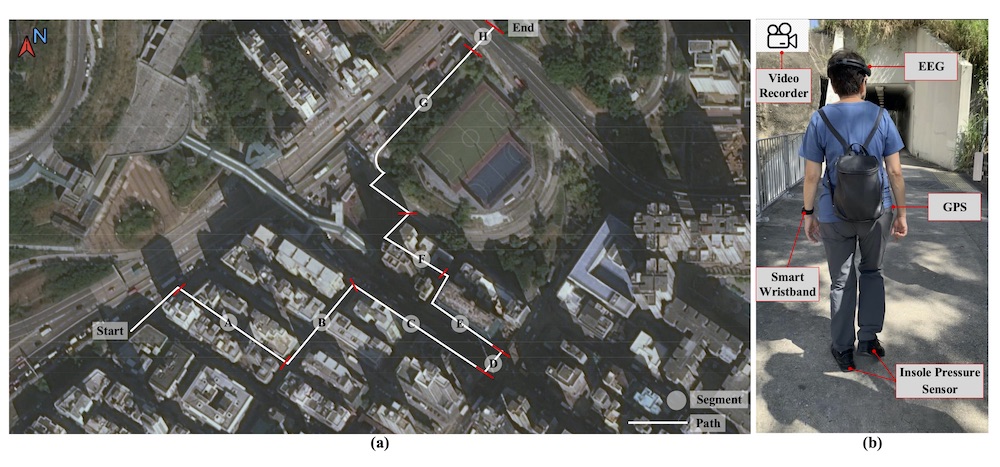
The environmental walk was divided into two phases. During the first phase, participants were equipped with non-invasive wearable sensors while they walked the path from start to finish (as shown in figure 2) at a self-directed pace. Two commercial, off-the-shelf, wearable sensors, a wristband-type sensor (Empatica E4) and a belt-clip-type GPS sensor (Qstarz BT-Q1000XT), were used for data collection. The wristband recorded electrodermal activity (EDA) at 4Hz and computed instantaneous heart rate (IHR) at 1Hz from the inter-beat interval (obtained from photoplethysmography signal). Physiological responses were spatially referenced using GPS co-ordinates, recorded at 1Hz. Older adults’ IHR and EDA were collected during a ten-minute rest period for baseline measurement and the entire period of the first phase of the environmental walk. During the second phase, participants walked the path without wearing the sensors. Instead, each participant was asked to categorise the path into “non-stress” and “stress” based on their perceived interaction and experience with the path. Participants also stated the intensity of their perceived stress – low or high intensity.
Prior to the environmental walk, two trained observers assessed the path using the Environment in Asia Scan Tool–Hong Kong version to facilitate comparisons with older adults’ physiological and perceived responses20. The experiment protocol was approved by the Human Subjects Ethics Sub-committee of the Hong Kong Polytechnic University.
Data pre-processing
Artefacts in the IHR data were corrected and heart rate variability (HRV) was calculated using a proprietary algorithm21. The raw EDA data was low pass-filtered using a Butterworth filter with a cut-off frequency of 0.28 Hz and smoothed with a moving average filter to remove non-EDA-related sensor readings22. Each participant’s IHR and EDA data were baseline normalised to reduce inter-individual variance.
Physiological reflectors of human-environmental stressful interactions
The path for the environmental walk was categorised into environmental conditions perceived as non-stress and stress by the older adults. Their physiological responses to these environmental conditions were analysed by assessing their autonomic nervous system (ANS), one of the major neural pathways activated by stress23. HRV and EDA are reliable indicators of the sympathetic and parasympathetic nervous systems23,24. The parasympathetic nervous system modulates heart rate (HR) at all frequencies between 0.15 and 0.4Hz. The sympathetic nervous system modulates HR at frequencies between 0.04 and 0.15Hz24. To model precisely the effect of environmental stressors, the spectral power of the low-frequency (LF) band (0.04-0.15) and high-frequency (HF) band (0.15-0.4) were calculated. The ratio of LF/HF was derived to represent the ratio of the sympathetic to parasympathetic influence on the heart.
An increase in eccrine sweat gland activity is observed when the sympathetic nervous system is stimulated, thus changing the conductivity of the skin22. EDA measures the conductivity of the skin and is one of the most frequently employed signals for detecting stress22,23. To model precisely the effect of environmental stressors, the EDA was decomposed into two components – phasic and tonic components – using a continuous decomposition analysis25. The phasic component results from an underlying sympathetic reaction to a stimulus, while the tonic component results from a tonic stimulus and changes slowly over time22,25. Because the tonic EDA component cannot be linked to a specific stimulus, the authors used only the phasic EDA component to represent older adults’ physiological responses.
The expected physiological effect of a stressor occurs slightly after the stimulus. The onset of a skin conductance response, when caused by a stimulus, is typically between one and five seconds after delivery of the stimulus23. To fully capture the physiological effect of a stressful environmental condition, the authors computed the maximum value of phasic activity within ten-second response windows (PhasicMax) extracted from the phasic EDA component, as an indicator of older adults’ physiological response. The LF/HF was derived from a window of 60 seconds using Welch’s periodograms21. Based on previous studies, a short-term window of 60 seconds can produce informative HRV measures26. Using the respective window size and advanced by one second for each second of the walk (to correspond to the 1Hz GPS data), continuous calculations of LF/HF and PhasicMax were made for the entire duration of each participant’s walk on the path.
Statistical and spatial analysis
A Wilcoxon signed-rank test was conducted to understand whether the physiological responses to environmental conditions perceived as non-stress were statistically and significantly different from environmental conditions perceived as stress. Spatial clustering analysis was conducted using Getis-Ord General G to confirm any spatial association in participants’ physiological responses. To determine locations on the path that stimulated a common physiological response among multiple participants, the authors conducted a hotspot analysis using Getis-Ord Gi* statistics.
Spatio-temporal analysis
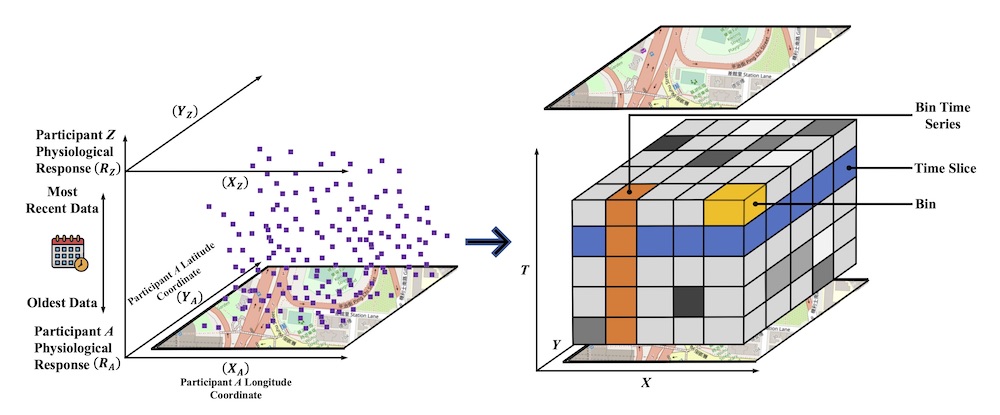
All participants’ physiological responses were scaled and aggregated into a space-time cube (STC), as depicted in Figure 3. Each bin in the STC contains participants’ physiological responses at a specific location (x,y) and time (t). A hexagon grid (here, set as 3m along the path) was used to construct the bins because the circularity of the hexagon makes it more representative of the curves in the path. Participants’ physiological responses were temporally binned at a daily interval for a total of ten days (only ten days of data were collected). Because each bin could span across more than one GPS point and contain multiple physiological responses, the median physiological response was computed to measure the central tendency of the multiple physiological responses in each bin. The emerging hotspot analysis tool in ArcGIS was used to identify the trends in the STC27. The temporal and spatial trends in the STC are analysed based on the Mann-Kendall trend test and Getis-Ord Gi*, respectively.
Results
Older adults’ perceived assessment and observers’ assessment of path condition
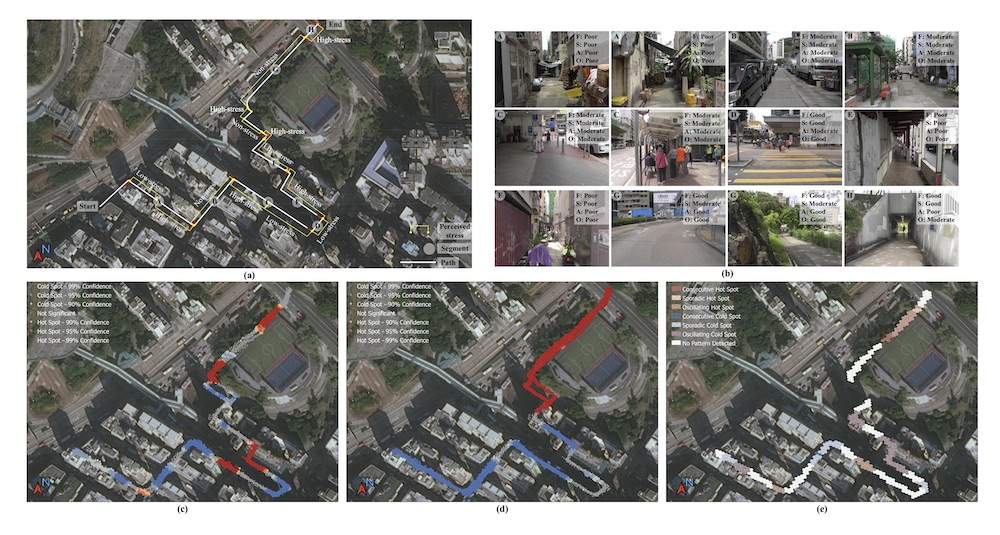
The path was labelled using the commonly perceived stress reported by participants (figure 4a). Observers rated each path segment as poor, moderate or good for each built environment domain: functionality, safety, and aesthetics (figure 4b).
Older adults’ physiological-environmental interaction
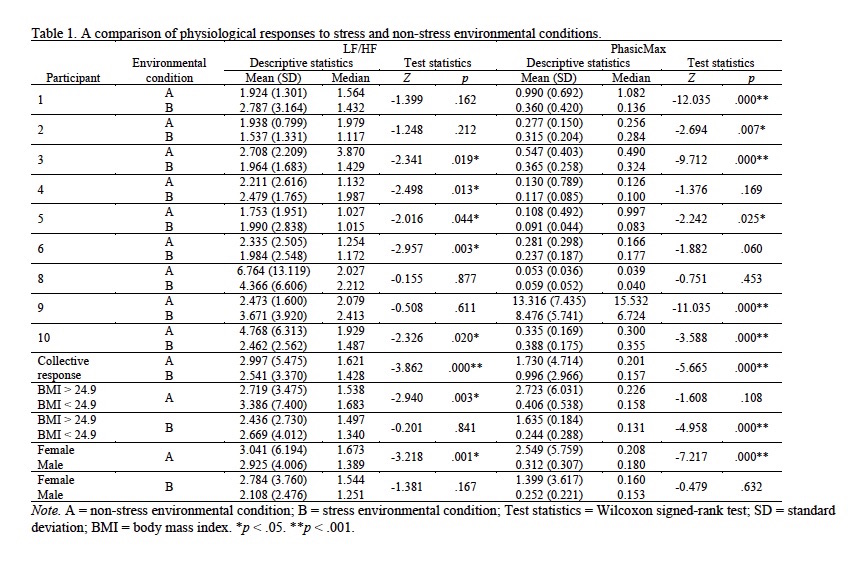
Statistical analysis: Results of the Wilcoxon signed-rank test (table 1) indicate a statistically significant difference in some of the older adults’ physiological responses to environmental conditions perceived as stress and non-stress. However, there are variations among some of the participants’ physiological responses (LF/HF and PhasicMax). For instance, participant 3 experienced a statistically significantly higher LF/HF response, whereas participant 6 experienced a statistically significantly lower LF/HF response to environmental conditions perceived as stress than environmental conditions perceived as non-stress. This variation was also observed in the PhasicMax responses of participants 1 and 2.
Differences in individual participant’s physiological responses to the environmental conditions indicate that no specific physiological response represents an environment’s condition; a high or low (LF/HF and PhasicMax) response can indicate either stress and/or a non-stress environmental condition. Further analyses show that the differences in individual participants’ physiological responses were due to their physical characteristics and gender. Physical characteristics were measured using the participant’s body mass index (weight/(height2)), defined as a surrogate measure of body fatness and an approximate indicator of health, physical fitness, and activity level28-29. Studies have indicated an inverse relationship between physical activity and body mass index (BMI)30-31. According to the Centres for Disease Control and Prevention, an adult with BMI below 18.5 is underweight, BMI between 18.5 and 24.9 is a healthy weight, BMI between 25.0 and 29.9 is overweight, and a BMI of 30.0 and above is obese32. In a non-stress environmental condition, only the data source from the heart rate (LF/HF) was statistically significant. Participants with a normal or healthy weight (BMI below 24.9) experienced higher (LF/HF) than overweight participants (BMI above 24.9). Only the data source from the SCR (PhasicMax) was statistically significant in stressful environmental conditions. Overweight participants (BMI above 24.9) experienced higher PhasicMax than participants with a normal or healthy weight (BMI below 24.9). This result could indicate that a stressful environmental condition poses high demand to overweight older adults. Female participants experienced a statistically significantly higher physiological response (both LF/HF and PhasicMax) to non-stress environmental conditions than male participants.
The time to complete the environmental walk varies among participants. This indicates that differences in pace, walking behaviour and level of observation influenced how participants interacted with the path, hence their physiological responses. The source of the physiological response (i.e. the related organ) influenced some participants’ physiological responses. For example, when the data is sourced from the heart rate (LF/HF), participant 5 experienced a statistically significantly higher physiological response to environmental conditions perceived as stress than environmental conditions perceived as non-stress. Whereas, when the data is sourced from the SCR (PhasicMax), the same participant experienced a statistically significantly lower physiological response to environmental conditions perceived as stress than environment conditions perceived as non-stress.
Aggregating all participants’ physiological responses (collective sensing) produced a consistent result for the HR and SCR data sources. The result from the collective physiological responses shows that, on average, participants experienced a statistically significant higher physiological response to environmental conditions perceived as non-stress than conditions perceived as stress. A recent study, conducted by Chrisinger and King, on relatively younger adults reported similar physiological responses from EDA data (skin conductive)33. Chrisinger and King reported that EDA was higher in environmental conditions with favourable features and lower in environmental conditions with less favourable features33.
Spatial analysis: The collective physiological responses were geo-referenced to the corresponding GPS positions for the entire path. The null hypothesis of the Getis-Ord General G statistic stipulates that there is no spatial clustering of participants’ physiological responses. An incremental spatial autocorrelation was conducted to determine the optimum scale of the analysis34. The threshold distance of 11m and 12.37m was obtained for the LF/HF and PhasicMax measures, respectively. The resulting z-scores of the Getis-Ord General G statistic for the LF/HF and PhasicMax measures were 2.595 (p < 0.01) and 7.890 (p < 0.01), respectively. The spatial clustering analysis confirms that multiple participants’ physiological responses are spatially associated and possess some common characteristics. The result implies that collective participants’ physiological responses are indicative of an environmental condition. A hotspot analysis was conducted on the LF/HF and PhasicMax measures using a threshold distance of 11m and 12.37m to determine the environmental conditions that triggered a common physiological response among multiple participants. The hot-spot analysis result for LF/HF and PhasicMax measures are presented in figures 4c and 4d, respectively. Hot spots are locations on the path with statistically significant high physiological response clusters. Cold spots are locations on the path with statistically significant low physiological response clusters.
Spatio-temporal analysis: Because the field data collection was conducted for only ten days and some participants’ physiological responses were corrupted or abnormal, this study only demonstrated the effectiveness of the space-time pattern mining using the LF/HF measure. The result of the space-time pattern mining based on the LF/HF measure with a threshold distance of 11m and a time interval of one day is presented in figure 4e. Several clusters of high physiological responses (hot spot) and low physiological responses (cold spot) were detected on the path. These hot- and cold-spot locations on the path are further categorised based on their occurrence over time. A consecutive hot (or cold) spot is a location with a single uninterrupted run of statistically significant hot- (or cold-) spot bins in the final time-step intervals. A sporadic hot (or cold) spot is a location that is an on-again then off-again hot (or cold) spot. An oscillating hot (or cold) spot is a statistically significant hot (or cold) spot for the final time-step interval that has a history of also being a statistically significant cold (or hot) spot during a prior time step. A consecutive hot (or cold) spot is a location with a single uninterrupted run of statistically significant hot- (or cold-) spot bins in the final time-step intervals. There were seven consecutive hot spots; four sporadic hot spots; 59 oscillating hot spots; two consecutive cold spots; 51 sporadic cold spots; 75 oscillating cold spots; and 217 spots with no pattern detected on the path.
Discussion
A comparison of older adults’ physiological-environmental interactions, older adults’ perceived stress assessments, and observers’ path audit
The authors compared older adults’ physiological-environmental interactions with the older adults’ perceived stress assessments and the observers’ audits of the path condition to confirm how well the elderly-centric sensing can represent the older adults’ interaction with the built environment. A comparison of perceived stress, expert path audit, and detected hot and cold spots on the path is presented in figure 4.
Segment A – an alley with several path obstructions – was perceived as stressful by participants. Segment A’s environmental condition was rated as poor by the auditors, and segment A was detected as a statistically significant cold spot, corresponding to physiological stress. The results across the three different assessment approaches confirm one another. The PhasicMax measure provided a more accurate representation of this segment with a higher confidence level than the LF/HF measure. Participants perceived segment B – a wide street – as non-stress. The auditors rated it as moderate, and half of segment B was detected as a statistically significant cold spot, corresponding to physiological stress. Participants had to cross a street in segment B; this street has vehicles parked along its shoulders. For participants, the anticipation of an approaching vehicle while crossing the street and having their field of view limited by the parked vehicles could have resulted in physiological stress. Because this occurrence is time-dependent, it could easily be missed during the path audit or while the participant reported their perceived stress. A review of the spatiotemporal analysis indicates a sporadic cold spot for parts of segment B immediately after the crossing, implying that older adults experienced physiological stress on some days and were not stressed on other days.
Segment C was perceived as stress, the environmental condition at segment C was rated as moderate, and parts of segment C were detected as a statistically significant cold spot (physiological stress) and hot spot (non-physiological stress) based on the LF/HF measure and cold spot (physiological stress) based on PhasicMax measure. Segment D was perceived as stress by participants, rated as good by the auditors, and was only detected as a significant cold spot (physiological stress) based on the LF/HF measure. Segment D is a crosswalk with traffic signals. Although the crosswalk was rated as good, it was perceived as stress and experienced as physiological stress. A plausible explanation for such responses could be the waiting time at the traffic light, which was about 68 seconds. The spatiotemporal analysis further indicates a sporadic cold spot on the crosswalk, suggesting that participants were stressed on the days with a longer waiting time for the traffic signal to turn green, and non-stressed on the days when the waiting time was shorter. This is another time-dependent occurrence that was not captured in the observers’ path audit.
Participants perceived segment E, an ongoing construction site, and segment F, an alley with path obstructions, as stressful, and the auditors’ rated them as poor. Segments E and F were detected as statistically significant (95-per-cent confidence level) physiological stress spots by the PhasicMax measure. The authors observed that all the segments that were perceived as stressful and rated as poor only resulted in physiological stress when the data source is from the SCR (PhasicMax) with a 95-per-cent confidence level. Physiological data sourced from the heart rate LF/HF mostly misclassified such segments or detected them with a 90-per-cent confidence level. This indicates that segments rated as poor conditions have more pronounced effects on older adults’ SCR than heart rate measures.
Physiological data sourced from the heart rate (LF/HF) is more indicative of the path conditions perceived as high stress or low stress than the data source is from the SCR (PhasicMax). For instance, segment G – a green space – was perceived as non-stress by participants, and the environmental condition of segment A was rated as good by the auditors. Segment H – a subway with graffiti – was perceived as high-stress and rated as moderate. Both heart rate and SCR data sources identified segment G to be non-stress, consistent with the perceived and path audit assessments. Only the heart rate (LF/HF) measure, however, was able to detect segment H as stress at a 90-per-cent confidence level.
Overall, older adults’ perceived assessment of the path, the observers’ path audit, and the assessment based on physiological responses confirm one another more than they contradict. These contradictions are expected because all of these assessment methods have inherent limitations. For instance, older adults’ perceived assessment is subjective; they could rate the mere presence of a gas station as stressful with a high-intensity rating, although the gas station may not distress the older adult. Although the observers’ path audit is objective, they cannot adequately distinguish between an environmental condition that is stressful for a person and not stressful for another person. Therefore, it’s expected that the perceived, objective and physiological response-based assessments should have some contradictions. Despite the contradictions, these methods can complement one another and improve the assessment of the built environment for older adults.
Collective sensing can address individual variability
This study shows that the relationships between older adults’ physiological responses and environmental conditions are less apparent at the individual level. An individual’s pace, walking behaviour, level of observation, physical characteristics, and gender influenced their physiological responses to stress and non-stress environmental conditions. The physiological response data source (i.e. the related organ) and time-dependent environmental factors also contributed to variability in older adults’ physiological responses. Indeed, variability in older adults’ physiological responses is what motivated this study. Assuming there is no individual variability, which will be the case when sensors are attached to mobility aids, an environment’s condition can be determined by using the intensity of older adults’ physiological response. But using the intensity of older adults’ physiological responses to represent their interaction with the environment would be misleading in this study. This study shows that using collective sensing – aggregating multiple participants’ physiological responses – can accommodate individual variability and capture any normality in the data, which is indicative of an environment’s condition.
Limitations and future directions
The results should be interpreted with these limitations in mind. This study used a predetermined walking path for data collection; restricting older adults to a particular path may affect how they interact with the environment. The study was based on a small sample size, and the analysis was conducted for a limited number of days. The next phase of this study will be conducted in an elderly neighbourhood with more diverse participants and without restricting older adults to a specific path. With these established relationships in older adults’ physiological responses, future studies should harness machine learning to optimise the detection of older adults’ stressful interactions with the built environment.
Conclusions
This study examines whether older pedestrians’ physiological reactions are indicative of urban built environment stressors. The results revealed that collective EDA and HR responses are useful indicators of older adults’ reactions to stress and non-stress built environment conditions. Older adults reacted somewhat differently to the same environmental conditions. These differences in responses were due to personal factors, the physiological response data source (i.e. the related organ), and time-dependent environmental factors. As a result of the differences in older adults’ physiological responses to the same environmental condition, it’s recommended that municipal officials, policymakers and urban planners should rely on collective participants’ physiological responses to assess an environmental condition. This recommendation is supported by the results from this study, which confirm that collective participants’ physiological responses are spatially and temporally associated and possess some common characteristics. In general, older adults’ perceived assessment of the path, the observers’ path audit, and the path assessment based on physiological responses confirm one another more than they contradict. Current advances in machine learning intelligence will be harnessed in future studies to optimise the detection of older adults’ stressful interactions with the built environment.
About the authors
Dr Alex Torku (corresponding author) is a lecturer at the Department of Civil Engineering, Surveying and Construction Management, Kingston University London. Dr Albert P. C. Chan is chair professor at the Department of Building and Real Estate, the Hong Kong Polytechnic University, Hong Kong. Dr Esther H. K. Yung is associate professor at the Department of Building and Real Estate, the Hong Kong Polytechnic University, Hong Kong. And Dr JoonOh Seo is associate professor, also at the Department of Building and Real Estate, the Hong Kong Polytechnic University, Hong Kong.
Funding
This study was funded by the Research Grant Council of Hong Kong through the Hong Kong PhD Fellowship Scheme PF17-02405; the Department of Building and Real Estate, the Hong Kong Polytechnic University; and Kingston University London.
References
1. United Nations. (2020). World Population Ageing 2020 Highlights: Living arrangements of older persons. New York: United Nations. ST/ESA/SER.A/451
2. WHO (World Health Organization). (2018). The Global Network for Age-friendly Cities and Communities: Looking back over the last decade, looking forward to the next. Geneva, Switzerland: WHO Press.
3. Torku, A, Chan, A P C, and Yung, E H K. (2021). Age-friendly cities and communities: A review and future directions. Ageing & Society, 41(10), 2242-2279. https://doi.org/10.1017/S0144686X20000239
4. Shumway‐Cook, A, Patla, A, Stewart, A, Ferrucci, L, Ciol, M A, and Guralnik, J M. (2003). Environmental components of mobility disability in community‐living older persons. Journal of the American Geriatrics Society, 51(3), 393-398. https://doi.org/10.1046/j.1532-5415.2003.51114.x
5. Portegijs, E, Rantakokko, M, Viljanen, A, Rantanen, T, and Iwarsson, S. (2017). Perceived and objective entrance-related environmental barriers and daily out-of-home mobility in community-dwelling older people. Archives of Gerontology and Geriatrics, 69, 69-76. https://doi.org/10.1016/j.archger.2016.11.011
6. Rantanen, T. (2013). Promoting mobility in older people. Journal of Preventive Medicine and Public Health, 46(Suppl 1), S50. https://doi.org/10.3961/jpmph.2013.46.S.S50
7. Mair, C A, Cutchin, M P, and Peek, M K. (2011). Allostatic load in an environmental riskscape: The role of stressors and gender. Health & Place, 17(4), 978-987. https://doi.org/10.1016/j.healthplace.2011.03.009
8. Lawton, M P. (1982). Competence, environmental press, and the adaptation of older people. Aging and the Environment: Theoretical Approaches, 33-59.
9. Webber, S C, Porter, M M, and Menec, V H. (2010). Mobility in older adults: A comprehensive framework. The Gerontologist, 50(4), 443-450. https://doi.org/10.1093/geront/gnq013
10. Lazarus, R S. (1990). Theory-based stress measurement. Psychological Inquiry, 1(1), 3-13. https://doi.org/10.1207/s15327965pli0101_1
11. Birenboim, A, Helbich, M, and Kwan, M P. (2021). Advances in portable sensing for urban environments: Understanding cities from a mobility perspective. Computers, Environment and Urban Systems, 88, 101650. https://doi.org/10.1016/j.compenvurbsys.2021.101650
12. Kabisch, N, Püffel, C, Masztalerz, O, Hemmerling, J, and Kraemer, R. (2021). Physiological and psychological effects of visits to different urban green and street environments in older people: A field experiment in a dense inner-city area. Landscape and Urban Planning, 207, 103998. https://doi.org/10.1016/j.landurbplan.2020.103998
13. Kim, H, Ahn, C R, and Yang, K. (2016). A people-centric sensing approach to detecting sidewalk defects. Advanced Engineering Informatics, 30(4), 660-671. https://doi.org/10.1016/j.aei.2016.09.001
14. Mascetti, S, Civitarese, G, El Malak, O, and Bettini, C. (2020). SmartWheels: Detecting urban features for wheelchair users’ navigation. Pervasive and Mobile Computing, 62, 101115. https://doi.org/10.1016/j.pmcj.2020.101115
15. Mourcou, Q, Fleury, A, Dupuy, P, Diot, B, Franco, C, and Vuillerme, N. (2013). Wegoto: A smartphone-based approach to assess and improve accessibility for wheelchair users. In 2013 35th Annual International Conference of the IEEE Engineering in Medicine and Biology Society (EMBC) (pp. 1194-1197). IEEE. https://doi.org/10.1109/EMBC.2013.6609720
16. Alberdi, A, Aztiria, A, and Basarab, A. (2016). Towards an automatic early stress recognition system for office environments based on multimodal measurements: A review. Journal of Biomedical Informatics, 59, 49-75. https://doi.org/10.1016/j.jbi.2015.11.007
17. Ulrich, R S, Simons, R F, Losito, B D, Fiorito, E, Miles, M A, and Zelson, M. (1991). Stress recovery during exposure to natural and urban environments. Journal of Environmental Psychology, 11(3), 201-230. https://doi.org/10.1016/S0272-4944(05)80184-7
18. Chiu, H F K, Lam, L C W, Chi, I, Leung, T, Li, S W, Law, W T, Chung, D W S, Fung, H H L, Kan, P S, Lum, C M, Ng, J, and Lau, J. (1998). Prevalence of dementia in Chinese elderly in Hong Kong. Neurology, 50(4), 1002-1009. https://doi.org/10.1212/WNL.50.4.1002
19. Lao, S S W, Low, L P L, and Wong, K K Y. (2019). Older residents’ perceptions of family involvement in residential care. International Journal of Qualitative Studies on Health and Well-Being, 14(1), 1611298. https://doi.org/10.1080/17482631.2019.1611298
20. Cerin, E, Chan, K W, Macfarlane, D J, Lee, K Y, and Lai, P C. (2011). Objective assessment of walking environments in ultra-dense cities: Development and reliability of the Environment in Asia Scan Tool – Hong Kong version (EAST-HK). Health & Place, 17(4), 937-945. https://doi.org/10.1016/j.healthplace.2011.04.005
21. Tarvainen, M P, Niskanen, J P, Lipponen, J A, Ranta-Aho, P O, and Karjalainen, P A. (2014). Kubios HRV–heart rate variability analysis software. Computer Methods and Programs in Biomedicine, 113(1), 210-220. https://doi.org/10.1016/j.cmpb.2013.07.024
22. Posada-Quintero, H F, and Chon, K H. (2020). Innovations in electrodermal activity data collection and signal processing: A systematic review. Sensors, 20(2), 479. https://doi.org/10.3390/s20020479
23. Boucsein, W. (2012). Electrodermal activity. New York: Springer.
24. Acharya, U R, Joseph, K P, Kannathal, N, Lim, C M, and Suri, J S. (2006). Heart rate variability: A review. Medical and Biological Engineering and Computing, 44(12), 1031-1051. https://doi.org/10.1007/s11517-006-0119-0
25. Benedek, M, and Kaernbach, C. (2010). A continuous measure of phasic electrodermal activity. Journal of Neuroscience Methods, 190(1), 80-91. https://doi.org/10.1016/j.jneumeth.2010.04.028
26. Shaffer, F, and Ginsberg, J P. (2017). An overview of heart rate variability metrics and norms. Frontiers in Public Health, 5, 258. https://doi.org/10.3389/fpubh.2017.00258
27. Esri. (2020). Emerging hot spot analysis (space time pattern mining) – ArcGIS Pro, Documentation. Available at: https://pro.arcgis.com/en/pro-app/tool-reference/space-time-pattern-mining/emerginghotspots.htm (accessed 10 September 2020).
28. Ding, C, and Jiang, Y. (2020). The relationship between body mass index and physical fitness among Chinese University students: Results of a longitudinal study. Healthcare (Basel) 8(4), 570. https://doi.org/10.3390/healthcare8040570
29. Prentice, A M, and Jebb, S A. (2001). Beyond body mass index. Obesity Reviews, 2(3), 141-147. https://doi.org/10.1046/j.1467-789x.2001.00031.x
30. Hemmingsson, E, and Ekelund, U. (2007). Is the association between physical activity and body mass index obesity dependent? International Journal of Obesity, 31(4), 663-668. https://doi.org/10.1038/sj.ijo.0803458
31. Bassett, D R, Schneider, P L, and Huntington, G E. (2004). Physical activity in an Old Order Amish community. Medicine & Science in Sports & Exercise, 36(1), 79-85. https://doi.org/10.1249/01.MSS.0000106184.71258.32
32. CDC (Centres for Disease Control and Prevention). (2021). About adult BMI. Available at: https://www.cdc.gov/healthyweight/assessing/bmi/adult_bmi/index.html#InterpretedAdults (accessed 16 September 2021).
33. Chrisinger, B W, and King, A C. (2018). Stress experiences in neighborhood and social environments (SENSE): A pilot study to integrate the quantified self with citizen science to improve the built environment and health. International Journal of Health Geographics, 17(1), 17. https://doi.org/10.1186/s12942-018-0140-1
34. Mitchel, A. (2005). The ESRI Guide to GIS analysis, Volume 2: Spatial measurements and statistics. ESRI Press.
Organisations involved