Cities / Active travel
But can I walk to work?
By Ed Parham, Eleri Jones, Ella McCoshan and Po Nien Chen | 07 Dec 2022 | 0
In this paper, Ed Parham, Eleri Jones, Ella McCoshan and Po Nien Chen describe the use of spatial modelling and statistical analysis to investigate the relationships between the built environment, socio-economic and demographic characteristics in the places where people walk to work.
Authors of scientific paper:
Abstract
Increasing daily activity through active travel brings many benefits, and it forms an objective of many policies and plans. However, delivering places that do this in practice appears more complicated, with research indicating that large amounts of development across England are likely to be car dependent.
This paper uses spatial modelling and statistical analysis to investigate the relationships between the built environment and socio-economic and demographic characteristics in the places where people walk to work. It combines Space Syntax’s internal research carried out in 2022 with the findings of real-world projects carried out between 2016 and 2021.
Our research finds that specific built environment characteristics are consistently found in places with higher levels of walking. These results provide insight to the disciplines involved in shaping and responding to the impacts of the built environment: planners, urban designers, architects, transport planners, and public health practitioners. Identifying these conditions can help design better new places, identify areas of risk (and potential) in existing cities, and in turn, allow multiple co-ordinated interventions to increase walking and cycling.
Keywords
Introduction
In the UK, obesity costs the NHS more than £6bn per year1, with further indirect costs calculated at £8.2bn2. Central and local government departments and organisations, including HM Treasury, the Department for Transport, the Department of Health and Social Care, the National Health Service, and Transport for London (TfL), have all produced policies aiming to combat this by considering multiple areas of intervention, including a sugar tax, banning fast food takeaways near schools, and providing better active travel infrastructure.
TfL estimates that if all Londoners walk or cycle for 20 minutes a day, it would save the NHS £1.7bn in treatment costs over 25 years3. In addition to health benefits, fewer people driving deliver wider benefits, through reduced fossil fuel use and better air quality. However, the findings of several recent reports show that the UK is failing to deliver places that make it possible to walk or cycle as part of an everyday lifestyle4,5.
This paper addresses the problem by analysing walking behaviour and built environment characteristics across England, at local authority and Middle Layer Super Output Area (MSOAs – a geographic hierarchy designed to improve the reporting of small area statistics in England and Wales) levels. Our study uses spatial modelling and statistical analysis to identify the physical, socio-economic and demographic characteristics of the places where more people walk. Better understanding these conditions enables a range of interventions to be co-ordinated across disciplines and departments to increase walking, and they include: identifying the specific characteristics to set in place through the design of new places; recognising problem areas to be mitigated in existing towns and cities; and finding quick-win areas with the underlying physical conditions already in place to support higher levels of walking.
Background
Multiple studies show that walking is associated with positive health outcomes and, consequently, creating walkable places is a widely adopted objective of many designers and planners, and it’s often included in policies, plans and masterplans.
Considering that multiple factors need to be in place, and that the decision to walk to work is an individual’s choice, the role of planners and designers is to set in place the built environment conditions that make it possible and convenient to walk. By better understanding how the physical environment is configured in areas with higher levels of walking, it becomes possible not only to be more specific in developing designs for new places but also to identify existing areas in need of intervention – and to specify this intervention.
Recent developments in technology and capability have made it possible to look at walking behaviour across the whole of England, and to use data science techniques to understand the contribution of the built environment alongside socio-economic and demographic factors.
The built environment, daily activity and health outcomes
There is an increasing mass of literature that sets out the role of daily activity, in the form of walking and cycling, in preventing illnesses such as obesity.
Work by the UK Government Office for Science Foresight Group produced a systems map illustrating the factors that contribute to obesity6. At the heart of this map is an imbalance between energy consumed and energy spent, with multiple genetic, non-spatial factors and individual decisions contributing. While at first it may appear that the built environment is insignificant, it’s important to note that the choices made by an individual take place within a wider spatial environment, and that this environment can be shaped to make something possible.
Unfortunately, while the design of the built environment has the potential to make certain activities possible, it can also make them impossible. This can be seen through the emergence in UK mainstream media of anecdotal stories of new homeowners spending more of their time driving7,8, data showing 83 per cent of passenger journeys are made by private vehicle9, and an increasing amount of research on the impacts of driving on personal health10 and on wider society, including climate impacts11.
However, health outcomes such as obesity are complex and shaped by many non-spatial factors. An individual may lead a sedentary lifestyle, choose not to walk or exercise, eat an unhealthy diet, or be affected by other factors. Even if they live in the most walkable environment, they may still be overweight or obese.
Designers and planners have a key role in making preventive daily activity possible, and while designers can’t guarantee a positive outcome, they can remove one of the variables – by setting in place the conditions that make walking and cycling possible. This requires a better understanding of the physical characteristics that make places less car-dependent and more walkable.
Describing the built environment
Until now, it has been difficult to describe the way multiple built environment systems work in combination with each other, from the point of a person.
Density provides a useful example. At a city scale, measures of density can be very helpful, but at smaller scales, the same density of development can be accommodated in multiple ways, using different street layouts, land use distributions, densities, and building typologies. Each of these options will produce very different urban environments and are likely to create very different patterns of daily activity.
Space Syntax has developed integrated urban models (IUMs) to combine characteristics such as density with the street network, land use and public transport12, and to link these to socio-economic datasets at a national scale. These models have been used to study health outcomes at the city scale – through work in 2017-18 with Devon and East Devon as part of the NHS Healthy New Towns and Integrated Care Excellence programmes. Space Syntax provided an IUM of Exeter for the public health team, who identified negative associations between obesity and a measure produced by the IUM, the Walkability Index (explained in more detail below) – that is, in more walkable urban areas, there were lower levels of obesity. The model could also help explain outlier areas; for example, while it was known in Exeter that obesity tended to follow deprivation, there were also places of lower income and lower obesity. Comparing these areas with the IUM revealed that these outlier areas were more walkable13.
IUMs were also used in 2021, as part of the Department for Transport-funded ADEPT Live Labs project, to analyse the specific spatial characteristics associated with higher and lower levels of active, public and private transport mode shares across the Thames Valley.
Methodology
Our study used multi-variate regression modelling to investigate relationships between urban form (using the IUMs and Walkability Index), and socio-economic, demographic and walking-to-work data.
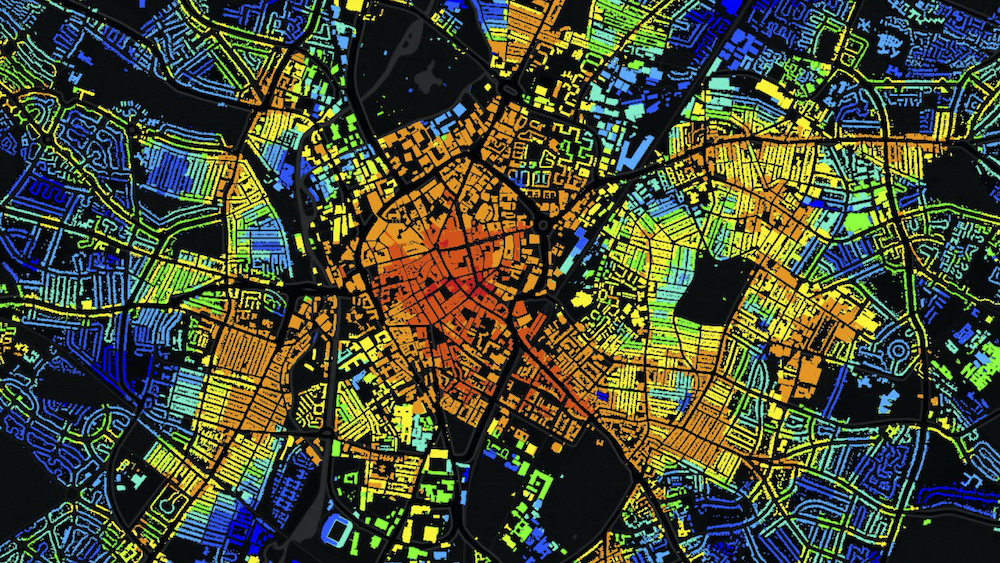
The IUM can be used to calculate a series of “indices”, including: a Walkability Index, which measures, for every property in a city, the mix and quantity of land use groups within a 15-minute walk, moving only through routes available to pedestrians (see figure 1); and a car dependence measure, which looks at the advantage of having access to a car in terms of the ratio of jobs accessible within 30 minutes by car, compared with using active and public transport.
The Space Syntax IUM is designed so it can be linked to datasets held at other geographies, allowing the Walkability Index to be combined with additional open datasets, including the census.
To identify features to include in the multi-variate model, correlation matrices were produced to visualise associations between individual factors. These matrices plotted IUM data, including the Walkability Index (as well as access to individual land uses), socio-economic data (income), and demographic factors (age, household size), individually against commuting mode-share data.
This process was carried out to look at relationships occurring at the local authority level (333 areas across England) and at the MSOA level (the Middle Layer Super Output Area used to publish census data covering 6791 areas of 5000-15,000 populations).
Separate regression models were then made across England at MSOA and local authority level. Models were interrogated for robustness, skewness, and to understand the contribution of each factor. Group workshops were held to discuss outliers and test the logic model behind these results.
Limitations
While this process is extensive and allows multiple features to be linked in a way that was not possible until relatively recently, there are still limitations that should be discussed:
Any aggregation of data is a simplification, and there will be some loss of richness as urban characteristics described at a street-by-street level are combined into a larger area. Unfortunately, nationwide socio-economic or demographic datasets at the building, street or even postcode level are unavailable and some aggregation of datasets is necessary.
Commute-to-work mode data were collected in the 2011 census. At the time of writing, the 2021 census in the UK has not been published, but this was carried out during the Covid-19 pandemic, where residents were instructed to record whether they were working from home at that time (rather than where they would normally work and how they would get there). Census data record journeys to work but don’t include walking as part of a public transport journey, nor how people get to school, go shopping, or walk for leisure. These trips will be missing from the datasets, and it’s estimated that commuting to work represents around 20 per cent of journeys in the UK9. Despite these shortcomings, this is the only nationwide, publicly available dataset.
These limitations are, to some extent, unavoidable, but they provide focus for the work, which is to understand which conditions are generally in place where more people walk to work. There will always be outliers, but creating a model that requires continuously updated data on every resident is undesirable and unrealistic for many reasons, as well as unnecessary. Cities and towns do not constantly change physically, but they set in place infrastructure that lasts for decades, if not centuries. The purpose of this modelling is to ensure we better understand how this infrastructure enables more people to walk more of the time, in order that it can be better designed.
Results
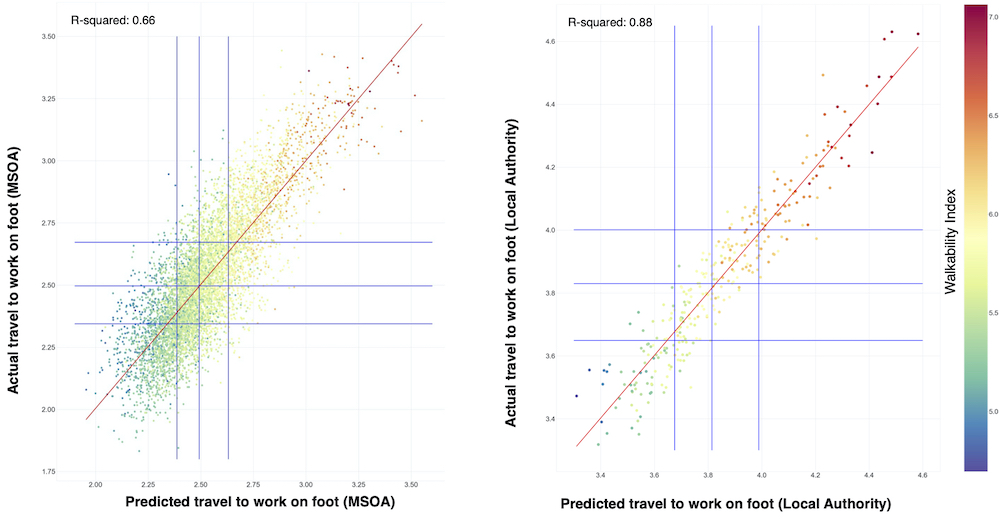
The regression analysis explains 89 per cent and 66 per cent of the variance in walk-to-work data at the local authority and MSOA levels, respectively (see figure 2). Both MSOA and local authority models are statistically significant and enable us to better understand the factors that influence where people walk to work. These include: the local built environment; settlement size and density of streets; age; household size; and income.
Analysis finds that places that combine higher Walkability Index scores, more residents aged 18-29, and more households without children positively affect the number of people who walk to work – that is, the higher these factors, the more people are found walking.
The size of the city and density of the street network (measured by node count) have a negative effect on the number of people who walk to work. However, in these places, there were significantly higher public transport mode shares, higher active mode shares (implying more cycling than walking at a certain city size), and lower levels of car ownership. These effects are seen at the edges of these settlements rather than the centres.
Mean income does not affect the number of people who walk to work at the MSOA level, but there is a negative effect at the local authority level – that is, higher-income areas record fewer people walking; however, this is possibly the result of data aggregation and the definition of administrative boundaries.
Findings
These results indicate that the spatial characteristics of an urban area – at city scale and the smaller 15-minute walk scale – are important, but so too are age and household size.
Places where more people walk, aside from having good street connectivity, share other characteristics. For example, the combination of multiple, mixed land uses, and connected street and pedestrian networks (all measured by the Walkability Index) means that, within a 15-minute walk, residents may easily access many kinds of different uses, including shops, schools, places of work, and places of leisure. This effectively creates more potential destinations to walk to, through a network that enables multiple options that allow shorter routes.
Places with a younger population (aged 18-29), and fewer children, are associated with more people walking to work, and there are likely to be multiple reasons for this. Many people start families and move to larger properties, and in the UK, prices for family-sized houses in more walkable city centre locations tend to be very expensive, meaning many families move to less central locations. Childcare requirements mean people have less time to drop/collect children at/from school and then walk to work. Indeed, this can also be seen in associations in census data, where numbers of households with children increase between ages 30 and 45 (0.75 r-squared), while fewer people aged over 45 walk to work (-0.17 ages 45-59 and -0.39 ages 60-64), and multiple car ownership per household increases in parallel (0.73 from age 45-59).
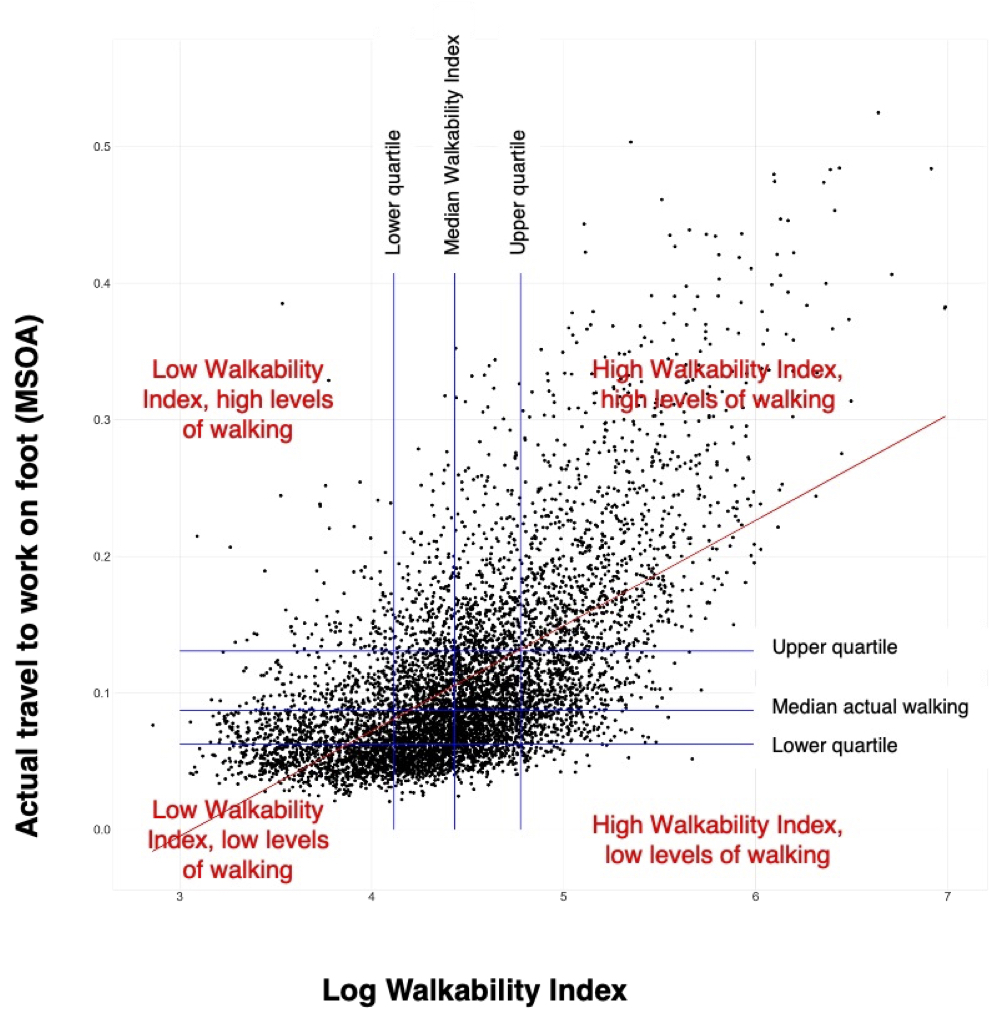
In analysing individual datasets, it could be seen that there were outlier areas that were unwalkable but which had higher than expected numbers of people walking, and often these could be explained by the presence of a younger population. The wider findings indicate that where people can walk to work, when they live close enough, then a walkable environment will encourage many to do so. There are neither many highly walkable areas where few people walk to work, nor the opposite, where many people walk in unwalkable areas (see figure 3). If a city is fragmented by large roads or other infrastructure, or formed of inward-looking cul-de-sac type developments, which effectively increase the distances between places, then fewer people walk.
Discussion
These results provide insight to the disciplines involved in shaping and responding to the impacts of the built environment – that is, the planners, urban designers, architects, transport planners and public health practitioners. The findings also inform local authorities as to how they can create targeted interventions, integrated across departments, to increase walking and benefit from its preventive health impacts.
What does this mean for strategic planning policy?
This research supports strategic decision-making, specifically in relation to the allocation of housing to sites where the underlying locational characteristics should be considered. This applies at multiple scales; for example, at the regional scale there is an argument that growth should be allocated where the larger-scale physical conditions are in place to enable more active, less carbon-intensive lifestyles – these are the larger cities with more dense spatial networks identified by the characteristic of node count at 10km.
Within these cities, the Walkability Index can be used to identify sites in places that are inherently more walkable (this can also be used at the masterplan scale – see below), where regeneration of brownfield land should be prioritised over greenfield development of peripheral areas.
Alongside decision-making on allocation of growth, a further element is to consider the supply of housing, and whether there is adequate supply of (market, affordable and social) family-size units in more walkable locations.
What does this mean for masterplans?
The research also gives a more precise description of how to design the foundational elements of a masterplan.
First is the layout of streets, and a key consideration of places where more people walk is that these don’t just provide a locally walkable neighbourhood but they integrate and overlap with well-connected parts of the wider city.
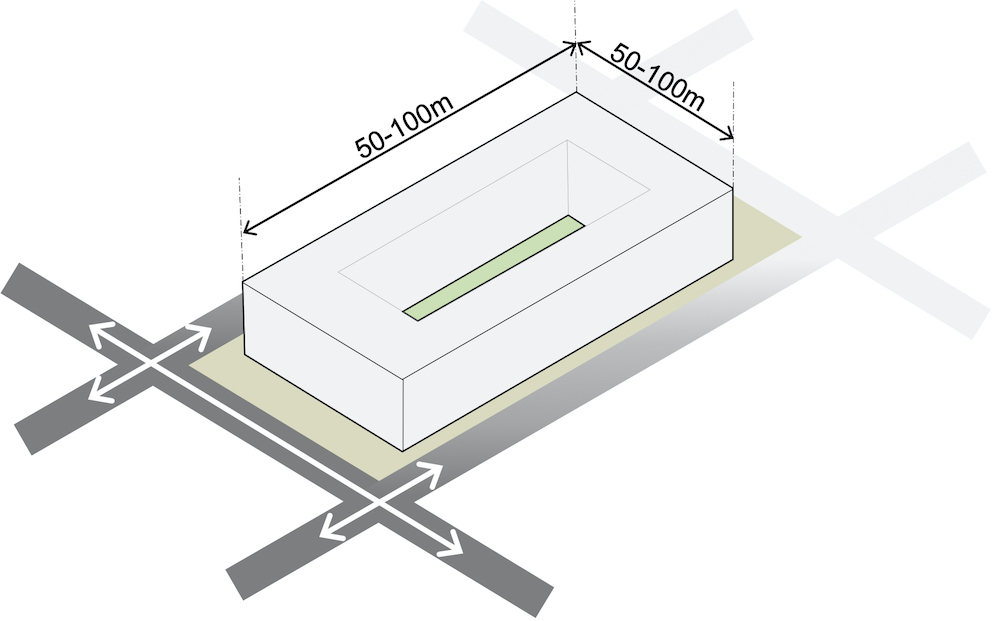
Detailed analysis of the places with higher levels of walking (and in the top quartile of walkability) shows that these areas are made up of urban blocks that are smaller and easier to walk around. Typically, the length of urban block edges is between 50m and 150m, with blocks located in continuously connected spatial networks offering between four and six connections to each street segment. As noted earlier, these spatial networks integrate directly with the best-connected streets across the wider settlement. More walkable areas not only have street networks that make it easier to move around but they are populated with a wider mix of uses that give more reasons for people to walk (see figure 4).
These findings are particularly relevant to the conversation around 15-minute cities. This terminology is very powerful, as it’s intuitive to members of the public as well as designers and policymakers; however, it needs careful translation into design proposals. One risk is that it focuses designers to look only at the very local scale – the neighbourhood or 15-minute area. It’s possible to frame much late 20th-century, car-dependent development as 15-minute cities, and this can be seen using examples of “new towns” in the UK.
Milton Keynes, for example, has a large “supergrid” designed for cars, which defines a series of smaller, discrete parts of the city. These discrete areas often have local facilities, such as schools, local shops or a park. However, because they have been designed in isolation from each other, these areas operate individually, which effectively reduces interactions between them and restricts the choice of services to which residents have access. Individual transport modes have their own separate network, with the result that large fast roads are difficult to cross. Despite many new towns having very high cycle-network provision, they’re not well used. Stevenage, for example, has some of the highest amount of cycle route per person, but the lowest cycling mode shares14. There are multiple reasons for this: active transport routes are often out of view from surrounding users; they are poorly lit and poorly maintained; and they are rarely integrated with the most important parts of the city, where people are more likely to want to get to.
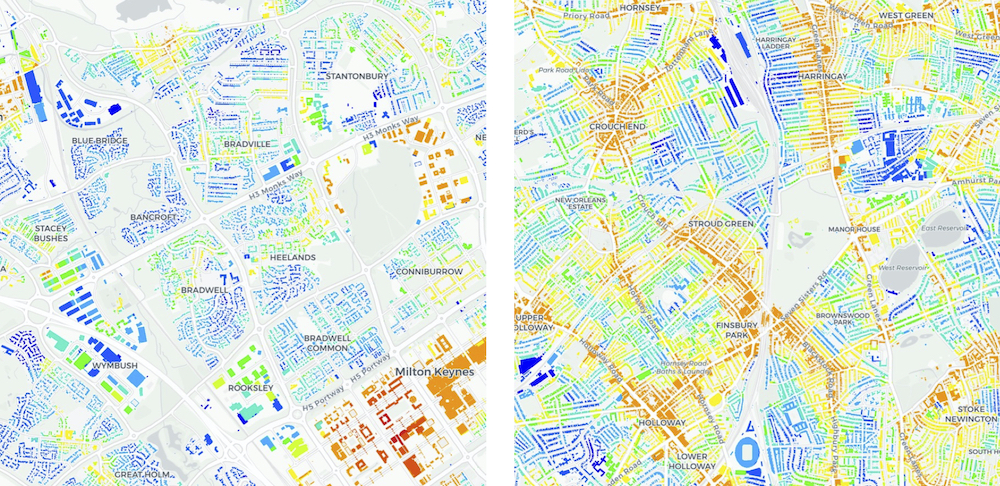
Studying an example of “muti-scale” urbanism – in this case, part of North London – it can be seen how the local and wider-scale spatial networks align and integrate with each other. This allows many smaller neighbourhoods to interact with each other in the same places to create larger, more accessible centres, and offering access to a wider range of services. Comparison of the Walkability Index in the two areas shows that in Milton Keynes, it may be possible for many people to access one local centre, but in North London, even in the most isolated places, it’s possible to reach more, larger centres (see figure 5). This overlap between users also creates potential for access, and supports a wider range of social and economic opportunities.
Comparing these different characteristics of walkability against travel behaviour further underlines the risk of pursuing the 15-minute city as a set of discrete, localised areas. In Milton Keynes, car ownership and commuting by car are higher, while commuting by active and public modes is lower.
What does this mean for public health strategies?
Through a better understanding of the built environments where people walk, two key pieces of insight can be provided:
First, by looking at the differences between actual levels of walking and expected levels, it’s possible to identify a set of places with the potential for quick wins. Places with lower-than-expected levels of walking have the conditions for more people to walk. In these areas, physical intervention is not needed, and unlocking the reasons why few people walk needs engagement. These might be a lack of lighting on certain stretches of streets, a lack of signage, a lack of time to walk, or another non-physical reason. In these places, it might be that a nudge-style campaign relating to walking could help, with incentives provided for leaving cars at home.
Second, less walkable urban areas that present a “place-risk” can be identified, and this can be combined with demographic datasets to understand if there is a more vulnerable community in parts of the city that are more car-dependent. There may be, for example, an older population in a less walkable area who would struggle to access the facilities they require. In these places, strategies could be developed to provide services in a different way.
Conclusion
This research shows that multiple conditions are in place where higher levels of walking are recorded, and that these conditions work across scales and domains. This leads to multiple lines of discussion about how to increase walking, such as how engagement and behaviour change campaigns could be targeted to specific population groups in particular areas; how planning policy could encourage larger family-size units in more central, more walkable areas; where mitigating measures, including shared/subsidised clean transport, could be suitable; and how performance metrics could be used alongside design codes to both enable design flexibility and make use of findings on where walking takes place.
It should be noted that while research is leading to a better understanding of the specific characteristics of the built environment to set in place, positive outcomes require individuals to make certain choices. Good urban policy, planning and design can encourage these choices, by making it possible to walk or cycle; however, it can’t guarantee that people will do this. As such, it’s useful to issue a caveat on the potential impact that design can have. While it may not be possible to guarantee a positive outcome, it can at least make it possible; unfortunately, and as shown by recent press stories and examples in the UK, bad design can make it almost impossible.
For practitioners, key learnings from this research are that a more walkable urban environment needs to work across multiple scales; it needs to create smaller, more permeable urban blocks, on a human person. Blocks should be populated with a mix of uses, and structured in a way that creates local areas that are integrated with, and part of, a much larger whole. The multiple urban systems in a city, specifically the movement and infrastructure network, need to be shaped around people, using multi-modal, mixed-use, slow-speed streets to integrate different areas, and to avoid, at all costs, the creation of fragmented towns and cities.
About the authors
Ed Parham, BA (Hons), Dip Arch, RIBA, is director of innovation and design at Space Syntax. Eleri Jones, BA (Hons), MSc, is an associate, digital at Space Syntax, and UCL/Space Syntax. Ella McCoshan, BA (Hons), MSc is a consultant at Space Syntax, and UCL/Space Syntax. And Po Nien Chen, BSc, MSc, MRes, is a senior consultant, digital, at Space Syntax, and UCL.
References
- Department of Health and Social Care (DHSC). (2022). Press release, New calorie labelling rules come in to force to improve nation’s health. https://www.gov.uk/government/news/new-calorie-labelling-rules-come-into-force-to-improve-nations-health
- Department for Transport (DfT). (2020). Gear change: A bold vision for cycling and walking. https://assets.publishing.service.gov.uk/government/uploads/system/uploads/attachment_data/file/904146/gear-change-a-bold-vision-for-cycling-and-walking.pdf
- Transport for London (TfL). (2017). Healthy Streets for London. https://content.tfl.gov.uk/healthy-streets-for-london.pdf
- Royal Town Planning Institute (RTPI). (2021). The location of development. https://www.rtpi.org.uk/locationofdevelopment#_Toc89101909
- Transport for New Homes (TfNH). (2022). Building car dependency: The Tarmac suburbs of the future. https://www.transportfornewhomes.org.uk/the-project/building-car-dependency/
- Government Office for Science (GOS). (2007). Tackling obesities: Future choices – Obesity System Atlas. https://assets.publishing.service.gov.uk/government/uploads/system/uploads/attachment_data/file/295153/07-1177-obesity-system-atlas.pdf
- Harrabin, R. (2018). Young couples trapped in car dependency. BBC, 24 Oct 2018. https://www.bbc.co.uk/news/science-environment-45956792
- Laker, L. (2022). New greenfield housing forcing people to use cars, report finds. The Guardian, 7 Feb 2022. https://www.theguardian.com/society/2022/feb/07/new-greenfield-housing-forcing-people-to-use-cars-report-finds
- Commission on Creating Healthy Cities. (2022). What creates healthy cities? Transport and mobility interventions.
- Flint, E, Cummins, S, and Sacker, A. (2014). Associations between active commuting, body fat, and body mass index: Population-based, cross-sectional study in the United Kingdom. BMJ, doi:10.1136/bmj.g4887
- Gossling, S, Choi, A, Dekker, K, and Metzler, D. (2019). The social cost of automobility, cycling and walking in the European Union. Ecological Economics, 158, doi:10.1016/j.ecolecon.2018.12.016
- Karimi, K, Parham, E, and Acharya, A. (2015). Integrated sub-regional planning informed by weighted spatial network models: The case of Jeddah sub-regional system. In Proceedings of the 10th International Space Syntax Symposium; London, UK.
- Chant, S, Shermer, K, and McNeill, J. (2018). Connecting wellness, urban form, care models and health outcomes: Cranbrook Healthy New Town case study. In Proceedings of the 2nd Healthy City Design International Congress 2018; London, UK. https://www.salus.global/article-show/www-healthycitydesign-global-29-abstracts-connecting-wellness-urban-form-care-models-and-health-outcomes-cranbrook-healthy-new-town-case-study
- Reid, C. (2017). Build it and they will come? Why Britain’s 1960s’ cycling revolution flopped. The Guardian, 19 September 2017, https://www.theguardian.com/cities/2017/sep/19/britains-1960s-cycling-revolution-flopped-stevenage
Further reading
- Age UK. (2021). Loneliness Maps, https://www.ageuk.org.uk/our-impact/policy-research/loneliness-research-and-resources/loneliness-maps/
- Hillier, B. (2009). Spatial sustainability in cities: Organic patterns and sustainable forms. In Proceedings of the 7th International Space Syntax Symposium. Stockholm, Sweden.
- Lai, KY, Sarkar, C, Kumari, S, Ni, MY, Gallacher, J, and Webster, C. (2022). Associations of residential walkability and greenness with arterial stiffness in the UK biobank. Environment International, https://doi.org/10.1016/j.envint.2021.106960
- Lai, KY, Sarkar, C, Kumari, S, Ni, M, Gallacher, J, and Webster, C. (2021). Calculating a national anomie density ratio: Measuring the patterns of loneliness and social isolation across the UK’s residential density gradient using results from the UK Biobank study. Landscape and Urban Planning, https://doi.org/10.1016/j.landurbplan.2021.104194
- Pineo, H. (2022). Healthy Urbanism: Designing and Planning Equitable, Sustainable and Inclusive Places. Palgrave Macmillan.
- Urban Task Force. (1999). Towards an Urban Renaissance. Routledge.
Organisations involved